Foods that combine meaningful protein and fibre content per 100 grams tend to contribute more to daily satiety than foods that provide very little of either. This is a visual map of common foods plotted by their protein and fibre density, grouped by food category, showing where each sits on both variables and how to use the pattern to inform food selection.
The most satiating foods per 100 grams combine both high protein and high fibre content, because protein and fibre are the two dietary variables with the strongest evidence for reducing hunger per calorie. This chart maps common foods on two axes: protein per 100 grams (vertical) and fibre per 100 grams (horizontal), with foods grouped by category. The high-protein high-fibre quadrant is dominated by nuts and seeds (almonds, peanuts, sesame seeds, pistachios) and by tempeh. The high-protein low-fibre quadrant contains most animal proteins (chicken breast, canned tuna, sardines, lean beef, prawns, salmon, eggs, cottage cheese, protein yoghurt, tofu). The low-protein high-fibre quadrant contains most legumes (chickpeas, kidney beans, mung beans, cannellini beans, split peas), plus artichoke and passionfruit. The low-protein low-fibre quadrant contains most refined grains, refined dairy, most fruit, and starchy vegetables. Using this map to bias food selection toward the upper-right of the chart tends to produce more sustainable satiety per calorie than a food selection built around the lower-left. This is not a protein quality ranking, and food selection depends on many variables beyond satiety.
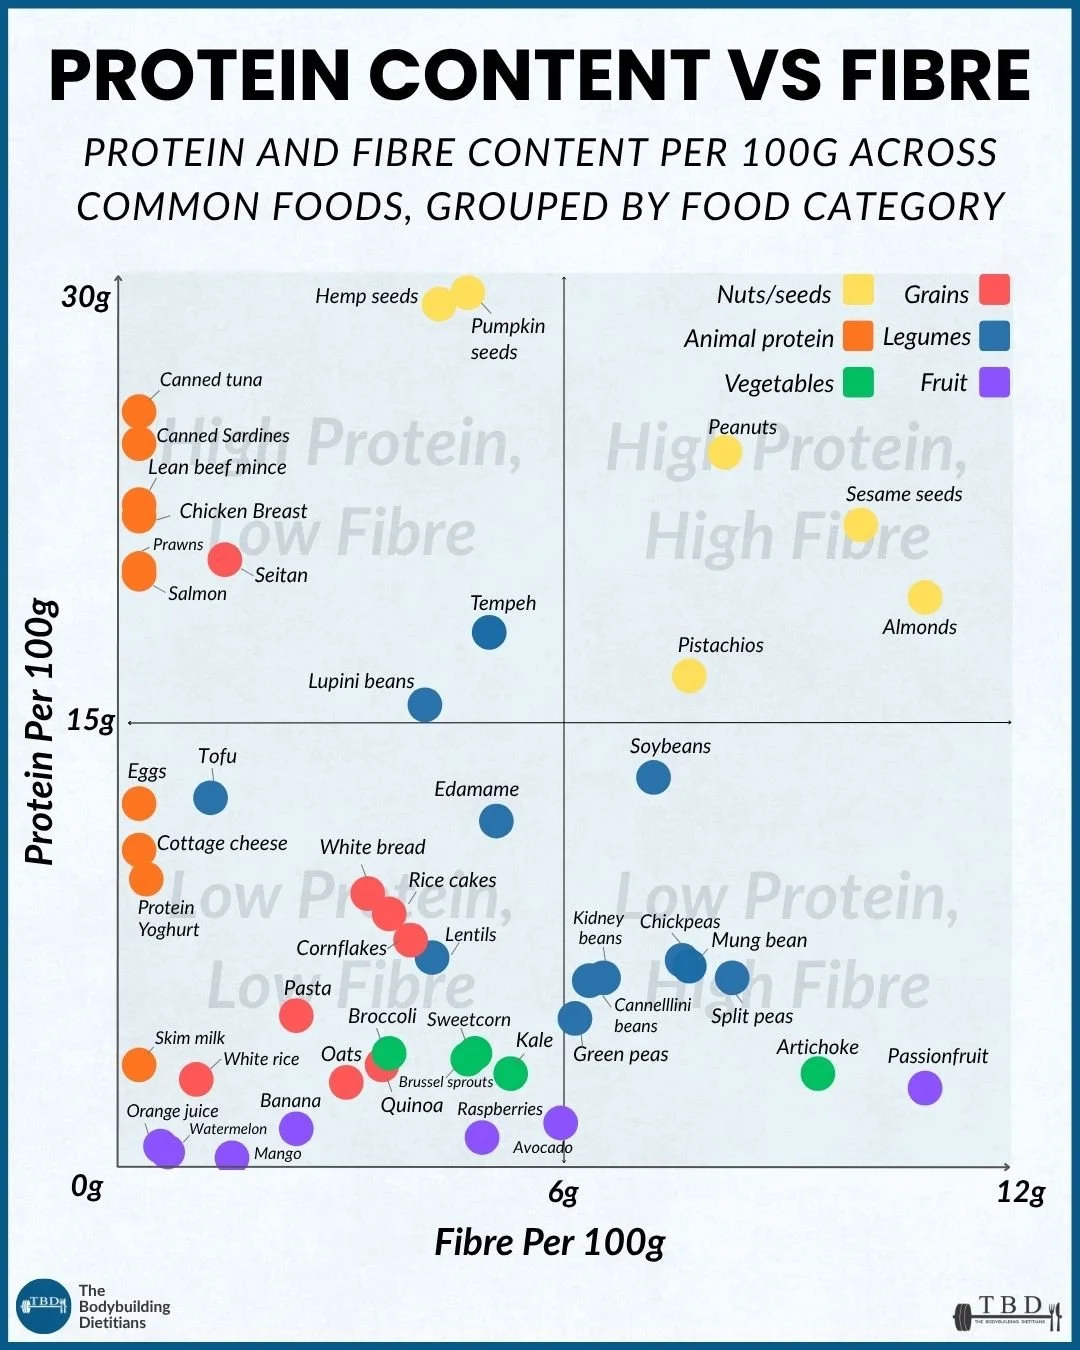
Common foods plotted by their protein and fibre content per 100 grams, using the Australian Food Composition Database. Foods in the upper right of the chart tend to contribute more to daily satiety per calorie than foods in the lower left.
Higher protein and fibre content is what makes some foods meaningfully more satiating than others. The evidence for both variables reducing hunger per calorie is consistent across the nutrition literature, and combining the two in a single food produces additive satiety effects that neither alone can match. A chart plotting foods on both axes at once turns this into a visual selection tool rather than a set of separate recommendations, which tends to be more useful in practice than reading through separate protein and fibre rankings.
The practical value of a chart like this is that it makes the underlying pattern easy to interpret. Foods that provide meaningful amounts of both protein and fibre per 100 grams will usually contribute more to satiety across the day than foods that provide very little of either. Foods low in both add energy without meaningful impact on fullness, which makes them easier to overconsume. Understanding where your regular foods sit on this map tends to give more useful information about appetite control than looking at calories or macros in isolation.
This article walks through the four quadrants of the chart, what each pattern means for food selection, and the practical implications for building a diet that supports satiety across fat loss, muscle gain, and general dieting contexts.
Why Does Protein and Fibre Density Predict Satiety?
Protein and fibre are the two dietary variables with the strongest and most consistent evidence for reducing hunger per calorie consumed, and both operate through mechanisms that are largely independent of each other.
Protein produces the strongest satiety response of any macronutrient per gram, working through several parallel mechanisms. It suppresses ghrelin (the primary hunger-signalling hormone) more effectively than carbohydrate or fat. It stimulates the release of satiety-signalling hormones from the gut including PYY, GLP-1, and cholecystokinin. It requires more energy to digest and metabolise than the other macronutrients (the thermic effect of protein sits at approximately 25 to 30 percent of the calories consumed, compared to 5 to 10 percent for carbohydrate and 0 to 3 percent for fat), which produces a slightly lower net energy yield per gram consumed. And amino acid signalling from protein digestion contributes to satiety through pathways that operate somewhat separately from the mechanical volume of the food.
Fibre produces satiety through mechanisms that operate largely on the mechanical and volumetric side rather than the hormonal side. Fibrous foods tend to have lower energy density (fewer calories per gram of food), which allows the stomach to fill on less energy. The physical volume of fibre slows gastric emptying, sustaining fullness signals for longer after a meal. Fermentation of fibre by colonic bacteria produces short-chain fatty acids that contribute to satiety signalling over the hours following a meal. And the mechanical presence of fibre in the small intestine slows the digestion and absorption of other nutrients, extending the period of sustained blood glucose and amino acid levels.
Combining the two produces additive effects that neither variable alone matches. A meal built around a high-protein high-fibre food (or a combination that delivers both) engages both the hormonal and mechanical satiety pathways simultaneously, which produces a more sustained and complete satiety response than a meal built around either variable in isolation.
This is why the upper-right quadrant of the chart (high protein and high fibre) represents the food selection zone that delivers the most satiety per calorie. It is not the only variable that matters in food selection, but it is one of the more useful lenses for building meals that support fat loss without excessive hunger, or general health without over-reliance on willpower to manage appetite.
What Foods Sit in the High-Protein High-Fibre Quadrant?
The upper-right quadrant is the most satiety-dense zone on the chart, containing foods that deliver meaningful amounts of both protein and fibre per 100 grams. This quadrant is dominated by two food categories.
Nuts and seeds occupy most of this quadrant, with several sitting well above the other food categories on both variables. Hemp seeds and pumpkin seeds top the chart with around 30 grams of protein per 100 grams, alongside meaningful fibre content. Sesame seeds, almonds, pistachios, and peanuts all sit in the high-protein high-fibre zone with protein content between 20 and 25 grams per 100 grams and fibre content between 8 and 12 grams per 100 grams. The practical limitation with nuts and seeds is their high energy density (typically 500 to 650 calories per 100 grams), which means they deliver strong satiety per calorie but small serving sizes contribute a lot of energy. Twenty to thirty grams of nuts or seeds per day is a reasonable inclusion range for most lifters, with adjustments based on daily calorie targets.
Tempeh sits in this quadrant as an outlier among plant proteins, delivering approximately 18 to 20 grams of protein and 7 grams of fibre per 100 grams. It is one of the few whole-food plant proteins that combines both variables at meaningful levels, which makes it a genuinely useful protein source for lifters wanting to include more plant-based options without sacrificing satiety.
The practical takeaway from this quadrant is that including a small serving of nuts or seeds daily (typically 20 to 30 grams) provides a compact source of both protein and fibre that supports satiety across the day. For lifters wanting a plant-based whole-food protein that combines both variables, tempeh is one of the strongest options.
What Foods Sit in the High-Protein Low-Fibre Quadrant?
The upper-left quadrant contains foods that deliver high protein content per 100 grams but little to no fibre. This quadrant is dominated by animal protein sources.
Animal proteins including canned tuna, canned sardines, lean beef mince, chicken breast, prawns, and salmon all sit in this zone with protein content between 20 and 30 grams per 100 grams and effectively zero fibre. These foods are foundational protein sources for most lifters, and their absence of fibre is not a limitation as long as the daily fibre target is being met from other sources (vegetables, legumes, whole grains, fruit, and the nuts and seeds discussed above).
Seitan (wheat-based plant protein) sits in this quadrant as a plant-based option with high protein content and low fibre content, similar in profile to the animal proteins.
Lupini beans sit near the boundary between quadrants, with protein content approaching 15 grams per 100 grams and modest fibre content, positioning them as a legume outlier that behaves more like a high-protein food than a typical fibre-rich legume.
The practical framework is that foods in this quadrant should be the foundation of protein intake for most lifters, particularly for meals where the protein needs to hit the muscle protein synthesis threshold (approximately 0.4 grams per kilogram of bodyweight per meal, which is roughly 25 to 40 grams of protein for most lifters). These foods are efficient sources of protein per calorie and per volume, and their lack of fibre is complemented by combining them with high-fibre carbohydrate sources and vegetables in the same meal.
What Foods Sit in the Low-Protein High-Fibre Quadrant?
The lower-right quadrant contains foods that deliver high fibre content per 100 grams with modest protein content. This quadrant is dominated by two food categories.
Legumes occupy most of this quadrant, with chickpeas, kidney beans, mung beans, cannellini beans, and split peas all sitting between 5 and 10 grams of fibre per 100 grams and 5 to 10 grams of protein per 100 grams. Green peas sit at the lower end of both variables among the legumes but still contribute meaningful amounts of each. Legumes are one of the more useful food categories for hitting daily fibre targets and provide a modest but real protein contribution alongside.
Certain vegetables and fruits also sit in this quadrant. Artichoke and passionfruit both provide substantial fibre per 100 grams with modest protein content. Soybeans sit near the boundary of the high-protein high-fibre and low-protein high-fibre quadrants, with meaningful contributions to both variables.
The practical framework is that legumes are one of the more valuable food categories for lifters wanting to increase daily fibre intake without adding meaningful volume. A single serving of chickpeas, lentils, or beans contributes substantially to fibre targets while also providing some protein toward the daily total. Building meals around a legume base (chickpea and lentil bowls, bean-based curries, mixed-bean salads) tends to produce meals that hit both fibre and protein reasonably well from a single main component.
What Foods Sit in the Low-Protein Low-Fibre Quadrant?
The lower-left quadrant contains foods that deliver little of either protein or fibre per 100 grams. This is the largest quadrant on the chart and contains most refined grains, most fruit, most starchy vegetables, and many everyday staple foods.
Refined grains and starches including white bread, white rice, pasta, rice cakes, and cornflakes all sit here. These foods provide energy in the form of carbohydrate but very little of the satiety-supporting variables. Their role in the diet depends on context: around training, they can be useful for their fast-digesting energy delivery, but at other meals of the day, they provide less satiety per calorie than the higher-fibre alternatives.
Refined dairy including skim milk, some lower-protein yoghurts, and certain cheeses sit in the low-protein low-fibre zone. Protein-enriched or higher-protein dairy products (cottage cheese, high-protein Greek yoghurt, cheese with higher protein content) sit higher on the protein axis and are meaningfully more satiating per calorie than their refined counterparts.
Most fruit sits in this quadrant on the protein and fibre map, despite fruit being a genuinely useful food category for other reasons (micronutrient density, phytonutrient variety, natural sugar for training energy). Banana, watermelon, mango, orange juice, and raspberries all sit at low protein and low-to-moderate fibre levels. Berries with skin (raspberries, blueberries) sit slightly higher on fibre than tropical fruit, but the overall pattern is that fruit contributes calories primarily from carbohydrate rather than from the satiety-supporting variables.
Some vegetables sit in this quadrant despite being nutrient-dense in other ways. Broccoli, brussels sprouts, sweetcorn, and kale all sit here on a per-100-gram basis. This is a limitation of the chart's convention (per 100 grams) rather than a real limitation of the vegetables. Cruciferous vegetables in particular are extremely low in calories, which means eating enough to contribute meaningfully to daily protein and fibre targets requires large portions, but those large portions are easy to achieve given the low calorie density. The vegetables can appear low on the chart despite being high-satiety foods once portion size is factored in.
Eggs, tofu, cottage cheese, and protein yoghurt sit near the boundary of the low-protein low-fibre and high-protein low-fibre quadrants, with moderate protein content (approximately 10 to 15 grams per 100 grams) and effectively zero fibre. These are still highly useful foods, and eggs and tofu in particular provide additional nutritional value (fat-soluble vitamins in eggs, isoflavones and calcium in tofu) that the chart doesn't capture.
The practical framework is that foods in the lower-left quadrant are not to be avoided, but they should not dominate the daily intake if satiety is a priority. Building meals with a strong contribution from the upper-right and upper-left (protein-dense) foods and a supporting contribution from the lower-right (fibre-dense legumes) provides more sustainable satiety than a diet built around the lower-left.
How Do You Use This Chart in Practice?
The chart is most useful as a food selection tool rather than as a strict prescription. Not every meal needs to be built exclusively from upper-right quadrant foods, and not every low-protein low-fibre food needs to be excluded. The practical application is to use the chart to identify patterns in current eating and adjust food selection accordingly.
Audit your current staple foods. Most lifters have a rotation of 15 to 25 foods they eat regularly. Plotting these mentally against the chart identifies where the current rotation sits on the satiety spectrum, and highlights opportunities to shift toward higher-density foods without changing the overall meal template. Replacing white rice with quinoa or bulgur, swapping a portion of pasta for lentils, or adding a spoonful of hemp seeds to a smoothie all shift the rotation upward and rightward on the chart without requiring wholesale dietary change.
Build meals with a spread across the chart. A well-constructed meal typically includes one food from the upper-left quadrant (animal or plant protein), one from the lower-right quadrant (legume or high-fibre carbohydrate), one to two servings from the low-protein low-fibre vegetable subcategory (large portions of low-calorie vegetables), and a small contribution from the upper-right quadrant (nuts, seeds, or tempeh). This structure covers protein, fibre, and satiety across the meal without requiring any single food to be optimal on both variables.
Bias food selection toward the upper-right during fat loss. During deliberate fat loss phases, prioritising foods higher on the protein axis and further right on the fibre axis tends to produce more sustainable satiety per calorie. The same total calories eaten from the upper-right of the chart produces less hunger than the same calories eaten from the lower-left. This is one of the more practical applications of the chart for lifters actively managing a deficit.
Recognise the volume adjustment for vegetables. Cruciferous and leafy vegetables often sit low on the chart in the per-100-gram convention but are among the most useful satiety foods in practice because their calorie density is so low that large volumes are easy to consume. A 300 to 400 gram portion of mixed vegetables contributes meaningfully to fibre and volume even when each individual vegetable sits low on the chart at the 100-gram convention.
For a more detailed look at how to build meals around these principles, our five-part meal framework covers the structural template we use with coaching clients to translate charts like this into practical daily eating.
Not Sure How to Translate This Chart Into Your Own Rotation?
The chart is most useful when the pattern is translated into an actual weekly meal rotation that fits training, budget, and personal preferences. If your current rotation feels like it isn't producing the satiety you'd expect from your calorie intake, or if fibre targets are consistently below the 25 to 30 gram range, mapping your current foods against this chart usually identifies the specific swaps that produce the biggest change. Our team works with clients to audit food rotations, identify the highest-value swaps, and build meal templates that hit both satiety and preference constraints.
What This Chart Doesn't Show
Two important caveats about interpreting the chart are worth naming explicitly.
This is not a protein quality ranking. The chart shows protein quantity per 100 grams, not protein quality. Amino acid completeness, digestibility, and DIAAS scores (Digestible Indispensable Amino Acid Scores) are not reflected here. Animal proteins generally have higher DIAAS scores than most plant proteins, meaning a gram of animal protein tends to contribute more effectively to muscle protein synthesis than a gram of most plant proteins. This matters for meal-level protein dosing but does not need to be the primary lens through which every food is evaluated. Food gets eaten for many reasons beyond amino acid completeness, and a chart focused on satiety and volume does not need to solve for every variable at once.
Portion sizes vary by food category. The per-100-gram convention makes food categories comparable but does not reflect how much of each food a lifter would actually eat in a serving. A typical serving of nuts might be 20 to 30 grams. A typical serving of chicken breast might be 150 to 200 grams. A typical serving of legumes might be 100 to 150 grams (cooked). The chart shows the density per unit weight, and the practical contribution to daily intake depends on how much of each food is eaten. Vegetables in particular tend to look less impressive on a per-100-gram chart than they actually are in practice, because typical vegetable servings are large.
Food composition data varies by source and preparation. The values in this chart are drawn primarily from the Australian Food Composition Database (AUSNUT) and are presented in hydrated form (raw or canned meats, canned drained legumes, cooked grains, and fresh vegetables and fruit) rather than as sold or dehydrated. Nuts and seeds are the exception, presented as eaten (dry). Other databases (USDA in the US, McCance and Widdowson in the UK) may show slightly different values for the same foods due to differences in sample selection, preparation, and analytical methods. There will always be some inconsistency in a dataset like this, and the goal was to keep the comparison as practical as possible rather than mathematically definitive.
Practical Takeaways
Foods that combine high protein and high fibre content per 100 grams tend to be more satiating per calorie than foods low in both. Protein works through hormonal satiety pathways, and fibre works through volume, gastric emptying, and short-chain fatty acid signalling. The two effects are additive.
The high-protein high-fibre quadrant is dominated by nuts, seeds, and tempeh. Including a small serving of nuts or seeds daily (20 to 30 grams) provides compact satiety support alongside a meal or snack.
The high-protein low-fibre quadrant contains most animal proteins and should be the foundation of protein intake for most lifters. The absence of fibre is not a limitation when the daily fibre target is being met from other sources.
The low-protein high-fibre quadrant is dominated by legumes, which are one of the most useful categories for hitting daily fibre targets with modest protein contribution alongside.
The low-protein low-fibre quadrant contains most refined grains, refined dairy, most fruit, and many everyday staples. These foods are not to be avoided, but they should not dominate the daily intake if satiety is a priority.
The chart is a food selection tool rather than a strict prescription. Building meals with a spread across quadrants, biasing food selection upward and rightward during fat loss, and recognising the volume adjustment for vegetables are the most useful practical applications.
This is not a protein quality ranking. Amino acid completeness and DIAAS scores are separate variables that matter for muscle protein synthesis but do not need to be the primary lens for every food selection decision.
Frequently Asked Questions
What foods have the highest protein and fibre content?
Hemp seeds and pumpkin seeds sit at the top of both variables in this chart, with approximately 30 grams of protein and 6 to 8 grams of fibre per 100 grams. Almonds, pistachios, sesame seeds, and peanuts also combine high protein (20 to 25 grams per 100 grams) with meaningful fibre (8 to 12 grams per 100 grams). Tempeh is one of the strongest whole-food plant proteins in this quadrant, with approximately 18 to 20 grams of protein and 7 grams of fibre per 100 grams.
Are protein and fibre the only factors that predict satiety?
They are the two variables with the strongest evidence, but they are not the only factors. Water content, food volume, meal composition (mixed macronutrients slow digestion more than single-macronutrient meals), palatability, and individual physiological response all contribute. Protein and fibre are the most useful lenses for food-level selection because they can be measured cleanly per 100 grams, but they should sit alongside broader considerations at the meal and daily levels.
Do legumes count as protein or fibre sources?
Both, but the balance depends on the specific legume. Chickpeas, kidney beans, cannellini beans, and mung beans sit in the low-protein high-fibre quadrant with 5 to 10 grams of protein and 5 to 8 grams of fibre per 100 grams. Lupini beans and soybeans sit higher on the protein axis. Tempeh (fermented soybeans) sits in the high-protein high-fibre quadrant. Practically, legumes are most useful as a fibre-dense carbohydrate source that contributes modest protein alongside, rather than as a primary protein source in a single-serve meal.
Why do fruits and refined grains sit in the low-protein low-fibre quadrant?
Fruits and refined grains provide energy primarily from carbohydrate rather than from protein or fibre. This does not mean they should be avoided. Fruit is nutrient-dense in ways the chart doesn't capture (micronutrients, phytonutrients, natural sugars useful around training). Refined grains have specific applications (fast-digesting energy around training, ease of preparation, palatability). The chart shows their satiety density, not their overall value.
Should I only eat foods from the upper-right of the chart?
No. A diet built exclusively from upper-right quadrant foods would be unnecessarily restrictive, would miss the nutritional contributions of the other quadrants, and would likely be harder to sustain than a diet that includes foods across the chart. The practical framework is to bias food selection toward the upper-right without excluding the other quadrants entirely. Building meals with a spread across the chart usually produces the best combination of satiety, nutritional completeness, and adherence.
Is animal protein better than plant protein for satiety?
Animal protein sources tend to be more concentrated per 100 grams and have higher DIAAS scores (protein quality), but the direct satiety effect per gram of protein is similar between animal and plant sources at equivalent doses. Plant proteins that combine protein and fibre in the same food (tempeh, lupini beans, soybeans, edamame) can produce stronger satiety per 100 grams than pure animal proteins because they engage both satiety pathways simultaneously. The best choice depends on individual dietary preferences, budget, and the overall structure of the diet.
If you want help auditing your current food rotation, identifying the highest-value swaps, and building a meal template that supports both satiety and personal preferences, our team can build a plan matched to your training, budget, and lifestyle. You can enquire about coaching or book a consultation with our team.