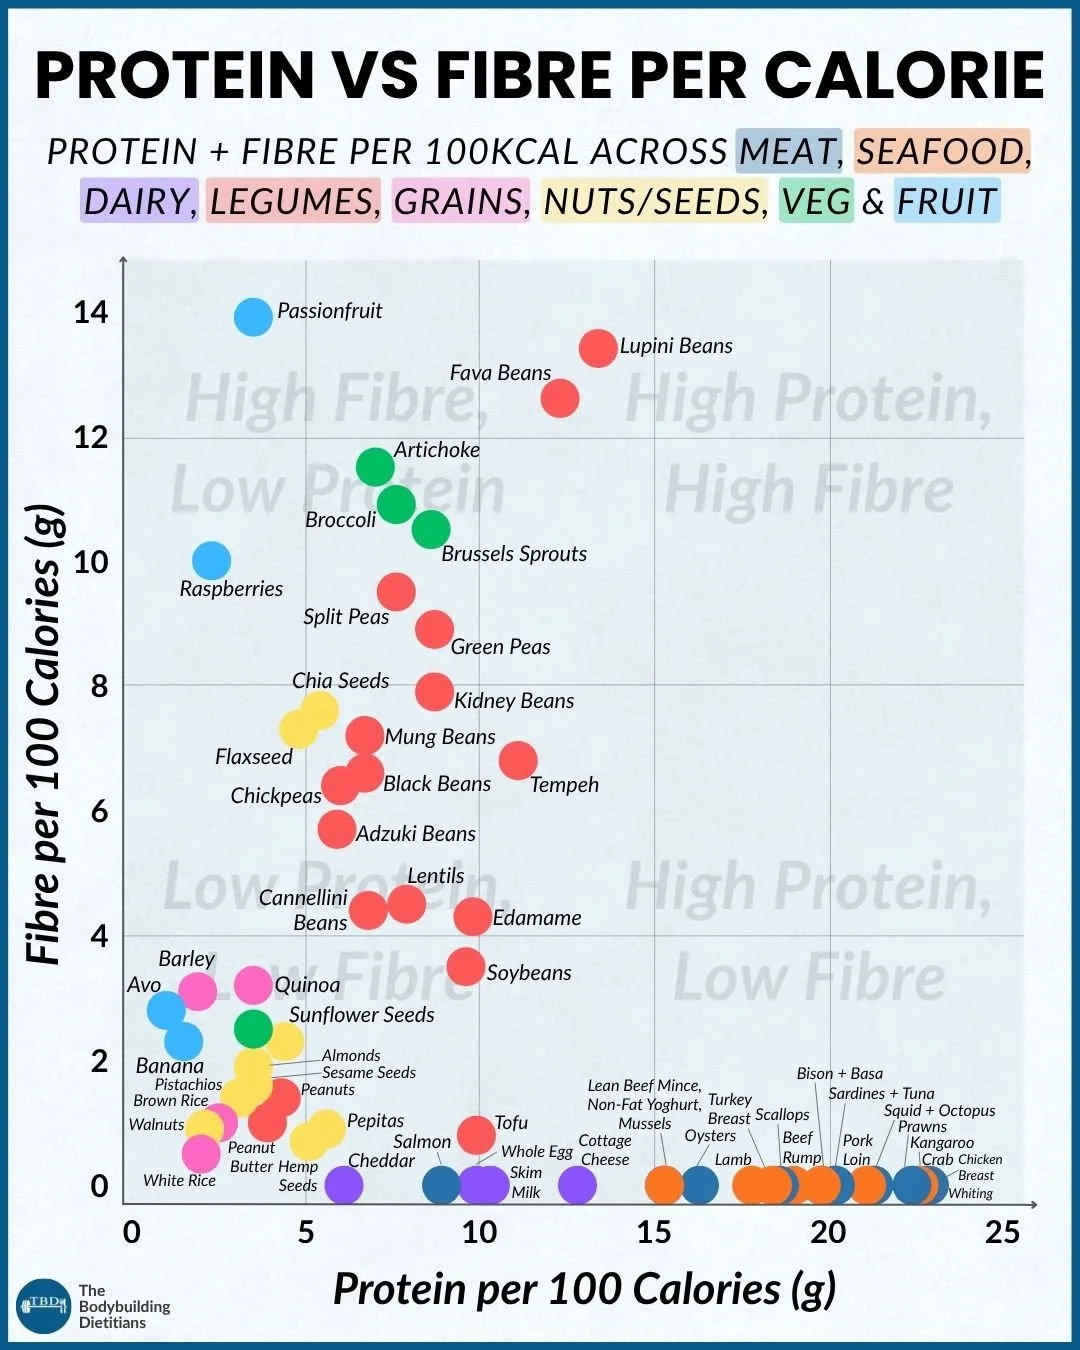
Foods plotted by protein and fibre per 100 calories rather than per 100 grams, which changes how food groups compare once calorie budget is the constraint.
Protein and fibre both matter for satiety, but which foods deliver the most of each within a fixed calorie budget is a different question to which foods contain the most per 100 grams. This guide compares major food groups by protein and fibre per 100 calories, and explains what that means for building meals that keep you fuller for longer within the calories you have.
Meat, seafood, and dairy are the most protein-dense food groups per calorie and contribute close to no fibre, while fruit, vegetables, grains, and nuts and seeds generally contribute more fibre per calorie but far less protein. Legumes are the notable exception, sitting in a useful middle ground by providing meaningful amounts of both protein and fibre within the same calorie allowance. This matters most for anyone working within a calorie budget, such as during a fat-loss phase, because per-calorie density determines how much protein and fibre a food contributes relative to what it costs from a fixed daily total, which is a different and often more actionable question than how much protein or fibre a food contains per 100 grams regardless of its calorie content. Protein quality also differs between food groups: animal sources generally provide all essential amino acids in highly digestible forms, while plant sources vary more in amino acid profile and digestibility, though a varied plant-based diet can still meet essential amino acid needs by combining complementary sources across the day. In practice, this is why mixed meals work well: pairing a protein-dense base with legumes, wholegrains, vegetables, fruit, nuts, or seeds increases fibre, food volume, and overall nutrient intake without requiring a large share of the calorie budget to be spent chasing either variable alone.
One of the easiest things to miss on a high-protein diet is fibre. Most people track protein closely and let fibre take care of itself, which works reasonably well when calories are generous but becomes a genuine trade-off once calories are constrained, because every gram of protein-dense food chosen is a gram of fibre-dense food not chosen, and the reverse is equally true.
This chart plots common foods by protein and fibre per 100 calories, grouped by food category, and is built to show how different food groups tend to contribute to protein and fibre intake within a calorie budget, rather than to rank individual foods against each other. That per-calorie framing matters more than it might first appear. Our earlier chart comparing protein and fibre per 100 grams answers a related but different question, useful for understanding a food's raw composition regardless of how many calories it costs. This chart answers the question that applies once you are working within a fixed calorie total, whether that is a cut, a maintenance target, or a goal of eating more fibre without overshooting energy needs: which foods deliver the most protein and fibre for what they cost you.
Satiety refers to the feeling of fullness that persists after eating, and is influenced heavily by a meal's protein and fibre content relative to its calorie load.
How Do Food Groups Compare on Protein and Fibre Per Calorie?
Meat and seafood are among the most protein-dense food groups per calorie and contribute essentially no fibre. Dairy sits close to the same position, offering strong protein density per calorie with minimal fibre contribution.
This is a specialisation rather than a limitation. These food groups are efficient, concentrated protein sources precisely because they carry very little else alongside the protein itself, which is what makes them useful as the protein anchor of a meal rather than the whole meal. Fruit, vegetables, grains, and nuts and seeds sit on the opposite end of the comparison, generally contributing more fibre per calorie while contributing far less protein. Vegetables and fruit in particular can be very fibre-dense relative to their calorie content, which is part of why they are valuable for food volume and satiety even when portion sizes are generous.
Legumes stand out because they do not specialise the way the other groups do. Lupini beans, fava beans, split peas, kidney beans, and black beans all provide meaningful amounts of both protein and fibre within the same calorie allowance, which is a genuinely useful middle ground rather than a compromise between two extremes. A food group that contributes to both targets at once is doing more work per calorie than one that only contributes to a single target, which is the practical reason legumes tend to earn a consistent place in a calorie-conscious diet regardless of whether the goal is fat loss, general health, or hitting a fibre target without a large calorie cost.
Why Does Per-Calorie Density Matter More Than Per-100g When Calories Are Limited?
Per-calorie density and per-100-gram density answer different questions, and which one is more useful depends entirely on what is constrained. When calories are the limiting factor, per-calorie density is the more actionable number.
A food that is fibre-dense per 100 grams but very low in calories, many vegetables fall into this category, can still be eaten in large volumes without threatening a calorie target, which is a real advantage the per-100g view captures well. Once the question shifts to what to include within a fixed calorie total, the per-calorie view is what determines the trade-off, because it reflects what a food costs from the budget you have to work with rather than what it contains at an arbitrary reference weight that may or may not resemble a typical serving. Two foods can look similar on a per-100g fibre chart and behave very differently once calorie cost enters the picture, particularly when comparing an energy-dense food eaten in a small serving against a low-energy food eaten in a large one. The per-calorie framing is most relevant during a structured deficit, when every food choice is implicitly competing against every other food choice for a limited number of calories, and least relevant when calories are generous enough that volume and variety matter more than efficiency.
Not Sure How to Fit Fibre Into Your Calorie Target?
Balancing protein and fibre becomes a genuine trade-off once calories are limited, and getting the mix wrong usually shows up as either persistent hunger or a diet that technically hits protein targets but leaves fibre and food volume badly short. Our team builds nutrition plans that account for both variables together, matched to the calorie target you are actually working with.
Does Protein Quality Differ Between These Food Groups?
Protein quality varies meaningfully between food groups, and this chart does not attempt to rank it. Animal proteins generally provide all essential amino acids in highly digestible forms, while plant proteins vary more in amino acid profile and digestibility.
This distinction matters for anyone relying heavily on plant sources for protein, though it is less of a practical barrier than it is sometimes made out to be. A varied plant-based diet can still provide all essential amino acids by combining complementary sources across the day, such as legumes alongside grains, without needing to engineer every single meal to be individually complete. For a full comparison of protein quality across sources using DIAAS scoring, our dedicated article on protein quality covers the topic in depth. This chart is best used alongside that information rather than in place of it. Protein and fibre density per calorie shows what a food contributes toward two specific targets, while protein quality shows how efficiently the body can use the protein it contains.
How Should You Use This Chart in Practice?
The practical value of this comparison is in building meals rather than choosing single foods. A protein-dense base paired with a fibre-dense addition covers more ground per meal than either food group alone.
Combining a lean meat, seafood, or dairy source with legumes, wholegrains, vegetables, fruit, nuts, or seeds increases fibre, food volume, and overall nutrient intake without requiring the whole meal to come from a single specialised food group. This is a large part of why mixed meals tend to outperform single-food approaches for satiety within the same calorie total. The protein source and the fibre source are each doing what they do best, rather than asking one food to deliver everything. Legumes are worth particular attention here, since they can function as either the protein anchor or the fibre contributor in a meal, or both at once, which gives them more flexibility than most other food groups on this chart.
If increasing fibre specifically is the priority rather than balancing both variables at once, a ranked comparison of individual foods by fibre content is more useful than this category-level view. Our guide ranking more than 80 foods by fibre content is built for that purpose, and pairs well with this chart once you have identified which food groups to focus on.
What Does This Chart Not Show?
This chart is a category-level comparison, not an individual food ranking, and a few caveats matter for reading it correctly. Individual foods within a category vary considerably, so a category's general position is a starting point rather than a rule for every food inside it.
Data is drawn from the Australian Food Composition Database and USDA, with product labels used where required, and values will vary slightly by product and preparation method. This is worth keeping in mind if a specific product or brand you use looks different from the general pattern a category shows. The chart also does not rank protein quality, food cost, micronutrient content, or overall diet quality, all of which are separate and equally important considerations that this comparison deliberately leaves out in order to isolate protein and fibre per calorie as clearly as possible.
Practical Takeaways
Protein and fibre per 100 calories answers a different question to protein and fibre per 100 grams, and the per-calorie view is the more actionable one once calories are limited.
Meat, seafood, and dairy are protein-dense per calorie with close to no fibre. Fruit, vegetables, grains, and nuts and seeds tend to contribute more fibre per calorie but far less protein.
Legumes are the exception, providing meaningful amounts of both protein and fibre within the same calorie allowance, which makes them unusually efficient for a calorie-conscious diet.
Protein quality still varies between these food groups regardless of density; animal sources are generally more complete and digestible, while plant sources benefit from variety across the day.
Mixed meals, pairing a protein-dense base with a fibre-dense addition, tend to outperform single-food-group approaches for satiety within the same calorie total.
This chart is a category-level starting point, not an individual food ranking, and does not account for protein quality, cost, or micronutrient content.
Frequently Asked Questions
What is the difference between protein and fibre per calorie versus per 100 grams?
Per-calorie density shows how much protein or fibre a food contributes relative to what it costs from a fixed calorie budget, which matters most when calories are limited. Per-100-gram density shows how much a food contains at a standard reference weight regardless of its calorie content, which is more useful for understanding raw food composition or when calories are not the limiting factor.
Which food group is best for both protein and fibre?
Legumes stand out as the food group that provides meaningful amounts of both protein and fibre within the same calorie allowance. Most other food groups specialise in one variable or the other, meat, seafood, and dairy for protein, and fruit, vegetables, grains, and nuts and seeds for fibre, while legumes contribute usefully to both at once.
Why do meat and seafood show almost no fibre on this chart?
Fibre is found only in plant foods, so animal protein sources such as meat, seafood, and dairy naturally contribute close to none regardless of how the data is measured. This is a specialisation rather than a downside, since these foods serve as efficient, concentrated protein sources within a meal that is then paired with a plant-based fibre contributor.
Does this chart account for protein quality?
No. This chart compares protein and fibre density per calorie only and does not rank protein quality, which depends on amino acid profile and digestibility rather than quantity. Animal proteins are generally more complete and digestible, while a varied plant-based diet can still meet essential amino acid needs through complementary food combinations across the day.
Is per-calorie density more important than per-100g density?
Neither is inherently more important; which one is more useful depends on what is constrained. Per-calorie density is the more actionable measure during a structured calorie deficit, when every food choice competes against every other for a limited total, while per-100g density is more relevant when calories are generous and volume or composition matters more than efficiency.
How can I use this chart to plan meals?
The most practical approach is to pair a protein-dense food group, such as meat, seafood, or dairy, with a fibre-dense addition, such as legumes, wholegrains, vegetables, fruit, nuts, or seeds. This covers both targets more effectively than relying on a single food group, and legumes in particular can serve either role depending on what the rest of the meal already provides.
If balancing protein and fibre within your actual calorie target feels harder than the theory suggests, our team can build a plan that accounts for both from the start rather than treating fibre as an afterthought. Enquire about coaching or book a consultation to talk through your current setup.