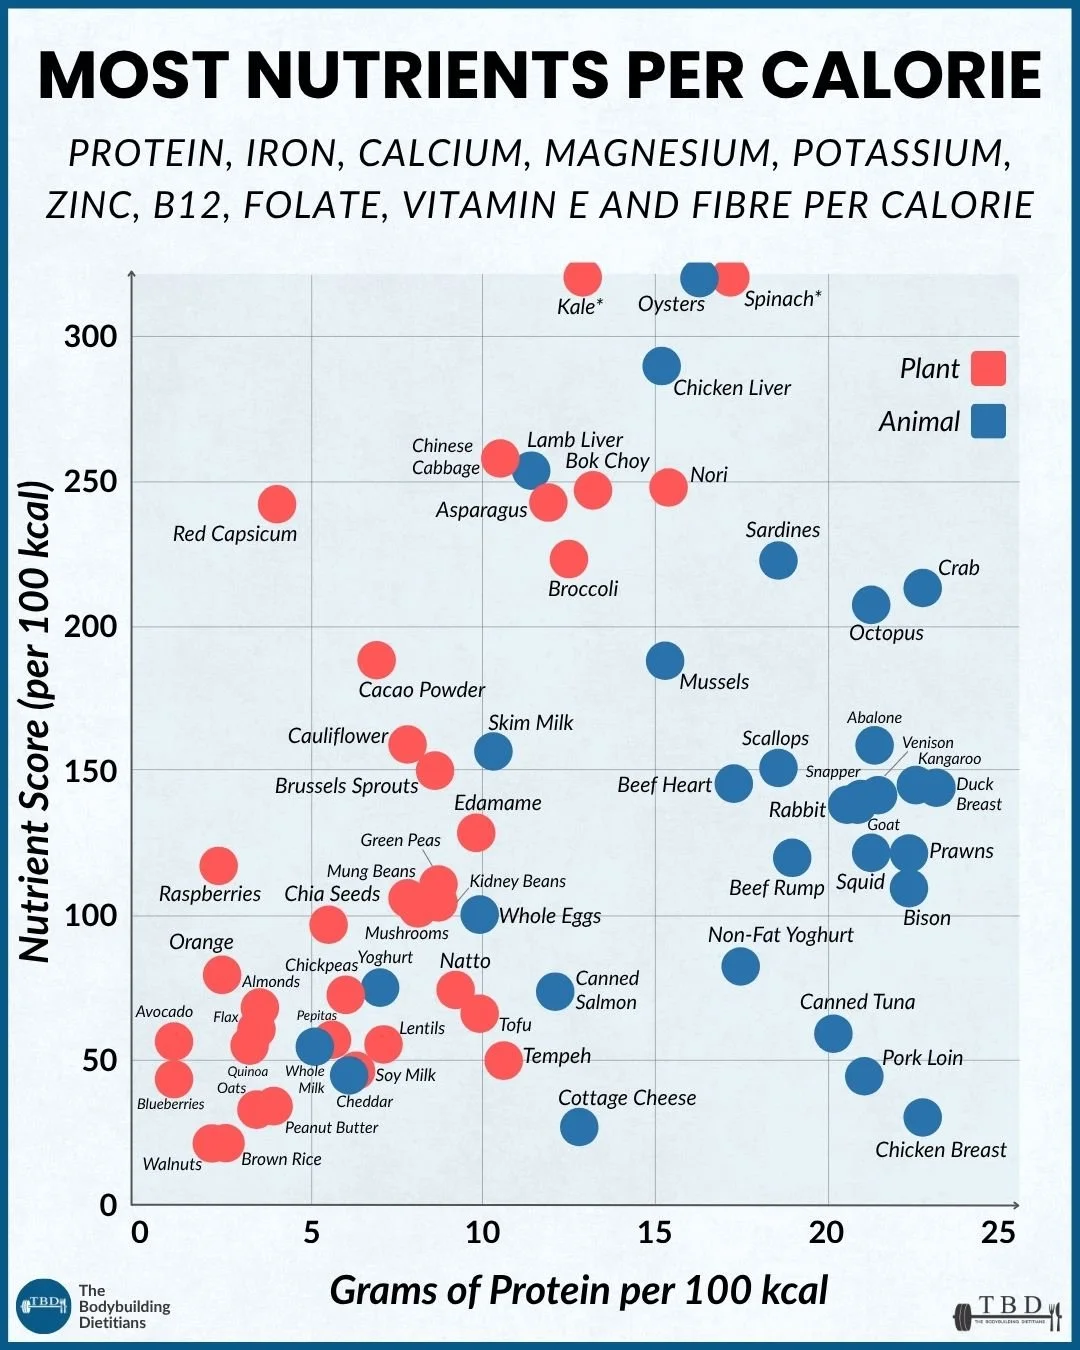
Some foods deliver substantially more nutrition per calorie than others. This is a reference ranking of common foods based on their combined delivery of iron, calcium, magnesium, potassium, zinc, B12, folate, vitamin E, and fibre per 100 calories, plotted alongside protein per 100 calories so both physique-relevant and general-health density can be compared at once. Includes the specific caveats about absorption, serving size, and the limited nutrient panel that shape how the ranking should be interpreted.
Nutrient density per calorie measures how much nutrition a food delivers relative to its energy content. This ranking uses a composite score combining nine nutrients (iron, calcium, magnesium, potassium, zinc, B12, folate, vitamin E, and fibre) expressed as the percentage of the recommended daily intake provided by 100 calories of each food, capped at 100 percent per nutrient and summed. The highest-scoring foods per calorie are leafy greens (spinach and kale score off the chart because 100 calories represents enormous serving volumes), followed by organ meats (chicken liver, lamb liver), cruciferous vegetables (bok choy, broccoli, Chinese cabbage, cauliflower, Brussels sprouts), and shellfish (oysters, mussels, scallops). The foods that deliver both high protein and high overall nutrient density include oysters, sardines, mussels, chicken liver, and lean meats like venison, kangaroo, and duck breast. Some foods score high in this ranking but need serving-size context to interpret sensibly (spinach at 100 calories per 600 grams), and the ranking has known limitations around absorption of iron, calcium, and B12 that vary by food matrix and by whether accompanying compounds like oxalates, phytates, or vitamin C are present. The ranking is most useful for comparing similar foods within a category (leafy greens, meats, dairy, legumes) to identify options worth rotating into an existing food selection rather than as a strict prescription of what to eat.
The composite score is calculated by taking the percentage of the recommended daily intake each food provides per 100 calories, capping each individual nutrient at 100 percent, and summing across the nine. Using calories rather than food weight gives context around how much nutrition a food delivers relative to the energy required to obtain it. A food scoring 200 delivers roughly the same amount of nutrition per calorie as a food scoring 100 but requires half the calories to reach that nutrition.
This article walks through what the ranking actually shows, which food categories score highest and why, how to combine the nutrient density lens with the protein density lens for a dual reading, the important caveats that shape how the ranking should be interpreted, and how to use it practically for food selection rather than as a strict prescription.
For related food selection lenses, our article on the most satiating foods covers protein and fibre density together, and our article on protein quality ranked by DIAAS covers protein bioavailability specifically. This article fills the specific micronutrient density gap that neither of those articles addresses.
What Do the Two Axes Actually Show?
Two variables plotted together give more information than either alone, which is why the source infographic uses this dual-axis approach.
The horizontal axis: protein per 100 calories. Foods further to the right deliver more grams of protein per unit of energy. Chicken breast at approximately 23 grams of protein per 100 calories sits at the far right. Whole eggs at approximately 10 grams sit in the middle. Peanut butter at approximately 4 grams sits to the left. This axis captures the same "protein per calorie" question the existing protein sources ranking article covers, but adds it as a reference point here so the dual comparison is possible.
The vertical axis: composite micronutrient score per 100 calories. Foods higher on the axis deliver more combined nutrition (iron, calcium, magnesium, potassium, zinc, B12, folate, vitamin E, fibre) per unit of energy. Leafy greens like spinach and kale score exceptionally high because their calorie density is so low that 100 calories represents an enormous volume of food packed with micronutrients. Organ meats and shellfish score high because they concentrate several vitamins and minerals in relatively small serving sizes. Refined grains, sugar, and oils score low because they provide substantial calories without corresponding micronutrient content.
Reading the four quadrants. The upper right (high on both axes) contains foods that deliver both high protein and high micronutrient density per calorie. This is where oysters, sardines, mussels, and organ meats sit. The upper left (high nutrient score, lower protein density) contains most leafy greens and non-starchy vegetables, along with foods like cacao powder and asparagus. The lower right (high protein density, lower nutrient score) contains most lean meats and lean dairy: chicken breast, canned tuna, pork loin, cottage cheese, non-fat yoghurt. The lower left (low on both) contains most nuts, refined grains, and calorie-dense plant foods that don't concentrate micronutrients per calorie.
Neither axis is universally more important than the other. For a physique-focused reader building meals around protein targets, the horizontal axis matters more for the primary protein source. For general health and micronutrient coverage, the vertical axis matters more. Building a food rotation that includes options from multiple quadrants tends to produce broader nutrient coverage than concentrating in any single quadrant.
Which Foods Score Highest Overall on the Nutrient Density Axis?
Several food categories consistently deliver high composite nutrient scores per calorie.
Leafy greens occupy the top of the chart. Spinach scores approximately 558 per 100 calories and kale scores approximately 388, both extending beyond the displayed axis. Bok choy, Chinese cabbage, and asparagus all sit in the 240 to 260 range. The specific reason leafy greens score so high is that they combine multiple micronutrients (folate, vitamin K, iron, magnesium, potassium, calcium in some varieties) at very low calorie density. This is also the specific reason serving size context matters: 100 calories of spinach is approximately 600 grams, which is a substantial portion of food.
Organ meats score exceptionally well per calorie. Chicken liver sits at approximately 290, and lamb liver at approximately 255. Organ meats concentrate B12, iron, folate, vitamin A, and several other nutrients at relatively high density per calorie. Cultural preference and taste have moved most modern Western populations away from regular organ meat consumption, but they remain among the most nutrient-dense animal foods available.
Cruciferous vegetables occupy the upper region alongside leafy greens. Broccoli, Brussels sprouts, and cauliflower all score in the 140 to 220 range depending on the specific vegetable. Cruciferous vegetables deliver folate, vitamin C, vitamin K, fibre, and sulphur compounds (glucosinolates and their derivatives like sulforaphane) at low calorie density.
Shellfish and specific seafood score well on both axes. Oysters sit near the top of the entire chart at approximately 315 nutrient score with 16 grams of protein per 100 calories. Mussels, scallops, and sardines all combine high protein density with high micronutrient density (particularly B12, iron, zinc, and selenium for shellfish, and calcium and omega-3s for sardines eaten with bones).
Red capsicum, nori, and cacao powder are notable individual outliers in the plant category. Red capsicum scores approximately 240 per 100 calories primarily through its vitamin C, vitamin A, and vitamin E content at low calorie density. Nori (dried seaweed) scores approximately 250 through iodine, iron, and folate content. Cacao powder scores approximately 190 through magnesium, iron, and antioxidant content, though the typical serving size of cacao powder is small.
The practical framework is that these high-scoring food categories are worth including deliberately in a food rotation, not because they need to dominate the diet, but because a small serving of each contributes disproportionately to daily micronutrient intake. A single serving of oysters, sardines, or organ meats delivers meaningful amounts of nutrients that would require large volumes of other foods to match.
Which Foods Deliver Both High Protein and High Nutrient Density?
The upper-right quadrant of the chart is the highest-value zone for physique-focused readers because these foods deliver both high protein per calorie and high micronutrient density per calorie simultaneously.
Oysters sit near the top of this quadrant with approximately 16 grams of protein per 100 calories and a composite nutrient score of approximately 315. Oysters deliver exceptional amounts of zinc (a single serving typically meets or exceeds daily requirements), B12, iron, and selenium at very low calorie density. The main practical barriers to regular oyster consumption are cost, taste preference, and availability, but for those who tolerate them, they're one of the most nutrient-dense protein sources available.
Sardines deliver approximately 15 grams of protein per 100 calories with a composite nutrient score of approximately 220. When eaten with bones (as they typically are from cans), sardines contribute meaningful calcium alongside protein, omega-3 fatty acids, B12, and vitamin D. Canned sardines are affordable, shelf-stable, and require no preparation, making them one of the more practical high-density options for regular inclusion.
Mussels sit at approximately 15 grams of protein per 100 calories and a score of approximately 190. Similar to oysters in the nutrient profile (high B12, iron, selenium) but typically more accessible in price and preparation.
Chicken liver delivers approximately 16 grams of protein per 100 calories with a composite score of approximately 290. This is the highest-scoring organ meat on the chart. A small serving (50 to 100 grams) once or twice per week contributes substantial nutrient density to the weekly total.
Lean meats including venison, kangaroo, rabbit, and duck breast sit at the far right of the chart with protein density around 20 to 23 grams per 100 calories and moderate composite nutrient scores in the 130 to 160 range. These are the highest-protein-density options on the chart, which makes them particularly useful for lifters hitting daily protein targets on tight calorie budgets, while still contributing meaningful iron, B12, and zinc.
Beef heart sits at approximately 18 grams of protein per 100 calories with a score of approximately 145. It's an organ meat that eats more like conventional meat than liver, making it more accessible for lifters wanting to include organ nutrition without adopting a strongly-flavoured food.
For lifters wanting to maximise both physique-relevant and general-health value per calorie, prioritising foods from this quadrant across the weekly rotation produces broader nutrient coverage than an equivalent rotation dominated by the high-protein-only lower-right quadrant.
Which Foods Deliver High Nutrient Density but Lower Protein?
The upper-left quadrant contains foods that score well on micronutrient density per calorie but don't contribute meaningfully to protein totals. This is largely the plant category.
Leafy greens (spinach, kale, bok choy, Chinese cabbage) dominate this quadrant. Cruciferous vegetables (broccoli, Brussels sprouts, cauliflower) sit here too. Other high-scoring plants include asparagus, red capsicum, mushrooms, cacao powder, and nori.
These foods aren't primary protein sources and shouldn't be counted toward the daily protein target as if they were. What they do is contribute disproportionately to daily micronutrient intake at very low calorie cost. A large serving of mixed leafy greens and cruciferous vegetables alongside a main meal adds substantial folate, vitamin K, potassium, magnesium, and fibre at a total cost of perhaps 50 to 100 calories, which leaves the calorie budget for higher-protein foods intact.
The practical framework is that these foods work as high-value additions to meals rather than as replacements for protein sources. A meal built around a lean protein source (from the lower-right quadrant), a fibre-rich carbohydrate, and a substantial serving of vegetables from this upper-left quadrant covers protein, energy, fibre, and the majority of daily micronutrient targets in a single meal structure.
Not Sure Where Your Food Rotation Is Actually Concentrated?
For most people, food rotation gets concentrated in specific patterns without deliberate attention: the same three protein sources, the same two vegetables, the same one starchy carbohydrate. Auditing that rotation against a nutrient density lens usually identifies the specific gaps that produce fatigue, digestion issues, or micronutrient shortfalls even when overall calorie and macro targets are being hit. This is one of the specific audits we work through with clients when the diet looks generally good but something isn't producing the outcomes it should. The corrections tend to be small (adding one or two specific foods to the rotation) rather than major, and the effects can be surprisingly meaningful.
Important Caveats: How to Read This Ranking Sensibly
Several caveats shape how the composite nutrient score should be interpreted. These aren't reasons to dismiss the ranking, but they matter for translating the chart into practical food selection.
Nutrient content is not the same as nutrient absorption. The composite score measures how much of each nutrient is present in the food, not how much the body actually absorbs. Absorption varies substantially depending on the food matrix and accompanying compounds.
Iron absorption is meaningfully higher from animal sources (haem iron at approximately 25 to 30 percent absorption) than from plant sources (non-haem iron at approximately 5 to 10 percent absorption). Vitamin C consumed alongside plant iron sources can improve absorption, while coffee, tea, and calcium consumed alongside can reduce it.
Calcium absorption from plant sources is often reduced by oxalates (particularly in spinach) and phytates. The high calcium content in spinach delivers less absorbed calcium than the raw number suggests. Kale and bok choy have lower oxalate content and better calcium bioavailability.
B12 bioavailability from plant sources is essentially zero for actual usable B12. Some plant foods (nori and other seaweeds, tempeh) contain B12 analogues that may not function as true B12 in the body.
Zinc absorption from plant sources is reduced by phytates in whole grains and legumes.
The practical implication is that animal source foods generally deliver more absorbed nutrition per gram of listed nutrient than plant sources for iron, calcium, B12, and zinc specifically. Plant sources of these nutrients still contribute meaningfully but require larger volumes or specific combining strategies to match the absorbed amount from animal sources.
Serving size context matters substantially. The ranking is per 100 calories, which for very low-calorie-density foods represents enormous serving volumes. Spinach at 100 calories is approximately 600 grams, kale at 100 calories is approximately 300 grams, and Chinese cabbage at 100 calories is approximately 800 grams. These are volumes that nobody eats in a single sitting. A more realistic serving of 100 to 150 grams delivers a fraction of the per-100-calorie nutrient contribution shown on the chart.
The practical implication is that leafy greens genuinely deliver excellent nutrient value per calorie, but the total daily contribution from realistic serving sizes is smaller than the per-100-calorie ranking would suggest. Building the daily diet around large but achievable servings (150 to 250 grams of mixed greens per day) delivers meaningful nutrient density without requiring the physically impossible amounts the per-100-calorie ranking implies.
The composite score only considers nine nutrients. Iron, calcium, magnesium, potassium, zinc, B12, folate, vitamin E, and fibre are important, but they're not the only nutrients that matter. Vitamin D (particularly relevant for lifters), vitamin K, vitamin C, vitamin A, omega-3 fatty acids, selenium, iodine, choline, and multiple B vitamins beyond B12 and folate aren't captured in this scoring system. Some foods score lower on this specific ranking but provide substantial amounts of nutrients not included in the score. Salmon, for example, scores modestly on this chart but provides exceptional omega-3 and vitamin D content that a broader scoring system would capture.
Phytonutrients and other beneficial compounds aren't captured. Berries, tomatoes, herbs, spices, olive oil, and other plant foods deliver phytonutrients (polyphenols, carotenoids, flavonoids) with documented health effects that aren't part of the nutrient score. A diet built exclusively on the highest-scoring foods on this chart would miss out on these compounds. For a related look at phytonutrient variety across plant foods, our article on eating the rainbow covers the colour-to-compound mapping.
How to Use This Ranking in Practice
The ranking is most useful as a food selection tool rather than as a strict prescription. Four practical applications tend to produce the most value.
Compare similar foods within a category. The chart's most direct utility is comparing options within a food category. Looking at the leafy greens shows where kale, spinach, bok choy, and Chinese cabbage sit relative to each other. Looking at the meats shows how chicken breast, canned tuna, and lean beef compare on both protein density and micronutrient density. Looking at the seafood shows the substantial difference between oysters and sardines (upper region) versus prawns and canned tuna (lower region). These within-category comparisons help identify options worth rotating into an existing selection.
Identify one or two specific gaps in your current rotation. Most food rotations are concentrated in a subset of the chart. Someone whose rotation is dominated by chicken breast, brown rice, and broccoli sits mostly in the lower-right and middle-left quadrants. Adding a serving of oysters, sardines, or organ meat weekly, or including more leafy greens, or adding red capsicum and cruciferous variety, shifts the rotation toward broader coverage without displacing the existing foundation.
Include organ meats or shellfish weekly if possible. These two categories occupy the highest-density positions on the chart and are the food groups most under-consumed in modern diets relative to their nutrient value. A single weekly serving of sardines, mussels, oysters, or chicken liver contributes meaningfully to weekly nutrient totals for zinc, B12, iron, and selenium in particular.
Prioritise deliberate variety over optimising any single food. The nutrient density ranking supports a broader plant and animal food selection rather than an optimised narrow rotation. No single food covers everything, and building a rotation that includes options from multiple quadrants of the chart tends to produce better outcomes than concentrating in any single food's specific nutrient profile.
For a broader look at the specific nutrient deficiencies most common in lifters and how to address them, our article on common nutrient deficiencies for lifters covers the practical framework for supplementation and food selection.
Practical Takeaways
Nutrient density per calorie measures how much nutrition a food delivers relative to its energy content. This composite score combines iron, calcium, magnesium, potassium, zinc, B12, folate, vitamin E, and fibre, expressed as the percentage of daily intake each food provides per 100 calories.
The highest-scoring foods per calorie are leafy greens (spinach and kale extending beyond the axis), organ meats (chicken and lamb liver), cruciferous vegetables (bok choy, broccoli, Brussels sprouts, cauliflower), and shellfish (oysters, mussels, sardines).
Foods that deliver both high protein density and high micronutrient density (upper-right quadrant) include oysters, sardines, mussels, chicken liver, and lean game meats like venison and kangaroo. These are the highest-value options per calorie for combining physique-relevant and general-health nutrition.
Serving size matters substantially. Leafy greens score exceptionally per 100 calories but 100 calories of spinach is approximately 600 grams. Realistic serving sizes deliver a fraction of the per-100-calorie nutrient contribution, though still meaningful amounts.
Absorption is not the same as content. Iron, calcium, B12, and zinc absorption varies substantially between animal and plant sources due to haem versus non-haem forms, oxalates and phytates, and food matrix effects. Plant sources of these nutrients contribute meaningfully but often require larger volumes or specific strategies to match absorbed amounts from animal sources.
The ranking is most useful for comparing similar foods within a category (leafy greens, meats, seafood, dairy) and identifying specific gaps in current rotation, rather than as a strict prescription of what to eat. Including organ meats or shellfish weekly and prioritising leafy green variety are the two most impactful practical applications for most lifters.
Frequently Asked Questions
What is nutrient density?
Nutrient density refers to the amount of nutrition a food delivers relative to its calorie content. High nutrient density foods provide substantial vitamins, minerals, and other beneficial compounds per calorie, while low nutrient density foods provide primarily energy without corresponding nutritional content. Measuring density per calorie rather than per gram gives context around how much nutrition you get for the energy cost of the food, which is particularly relevant for people managing calorie intake for body composition goals.
What are the most nutrient-dense foods?
The most nutrient-dense foods per calorie include leafy greens (spinach, kale, bok choy, Chinese cabbage), organ meats (chicken liver, lamb liver), cruciferous vegetables (broccoli, Brussels sprouts, cauliflower), and shellfish (oysters, mussels, sardines). Foods that deliver both high protein and high micronutrient density include oysters, sardines, mussels, chicken liver, and lean game meats. Serving size context applies: leafy greens score exceptionally well per calorie but require large serving volumes to reach 100 calories.
Are leafy greens really that nutritious?
Yes on a per-calorie basis, though the serving size context matters. Spinach at 100 calories represents approximately 600 grams, and kale at 100 calories is approximately 300 grams. A realistic serving of 100 to 150 grams delivers a fraction of the per-100-calorie nutrient contribution but still contributes meaningfully to daily folate, vitamin K, magnesium, potassium, and iron intake. The practical framework is that leafy greens are worth including in substantial daily servings (150 to 250 grams total per day of mixed greens is a reasonable target) rather than expecting the per-100-calorie ranking to translate directly into daily intake.
Do plant iron sources absorb as well as animal iron?
No. Animal sources contain haem iron, which is absorbed at approximately 25 to 30 percent efficiency. Plant sources contain non-haem iron, absorbed at approximately 5 to 10 percent efficiency. Vitamin C consumed alongside plant iron sources can improve absorption meaningfully, while coffee, tea, and calcium consumed at the same meal reduce it. For plant-focused eaters, this means iron intake needs to be higher in total to achieve the same absorbed amount as an omnivorous diet, and combining plant iron sources with vitamin C at the same meal is a practical strategy.
Should I eat organ meats?
Not required, but organ meats are among the most nutrient-dense foods available and warrant inclusion for readers who tolerate them. A single weekly serving of chicken liver (50 to 100 grams) contributes exceptional amounts of B12, folate, iron, and vitamin A. For readers who don't enjoy the taste of organ meats, similar nutrient benefits can be achieved through shellfish (oysters, mussels), specific vegetables (leafy greens, cruciferous variety), and mixed animal protein sources.
Does this ranking mean I should stop eating chicken breast?
No. The ranking shows that chicken breast delivers high protein density (approximately 23 grams per 100 calories) with lower composite micronutrient density. This makes it an excellent primary protein source for hitting daily protein targets efficiently, particularly during fat loss phases. What it doesn't do is provide broad micronutrient coverage on its own. Building a food rotation that includes chicken breast alongside options from higher-nutrient-density categories (leafy greens, cruciferous vegetables, occasional organ meats or shellfish) produces better overall nutrient coverage than a rotation dominated by any single food.
If you want help auditing your current food rotation against nutrient density, identifying the specific gaps that could be addressed with small additions rather than major overhauls, and building a rotation that supports both your physique goals and broader nutrient coverage, our team can build a plan matched to your specific situation. You can enquire about coaching or book a consultation with our team.