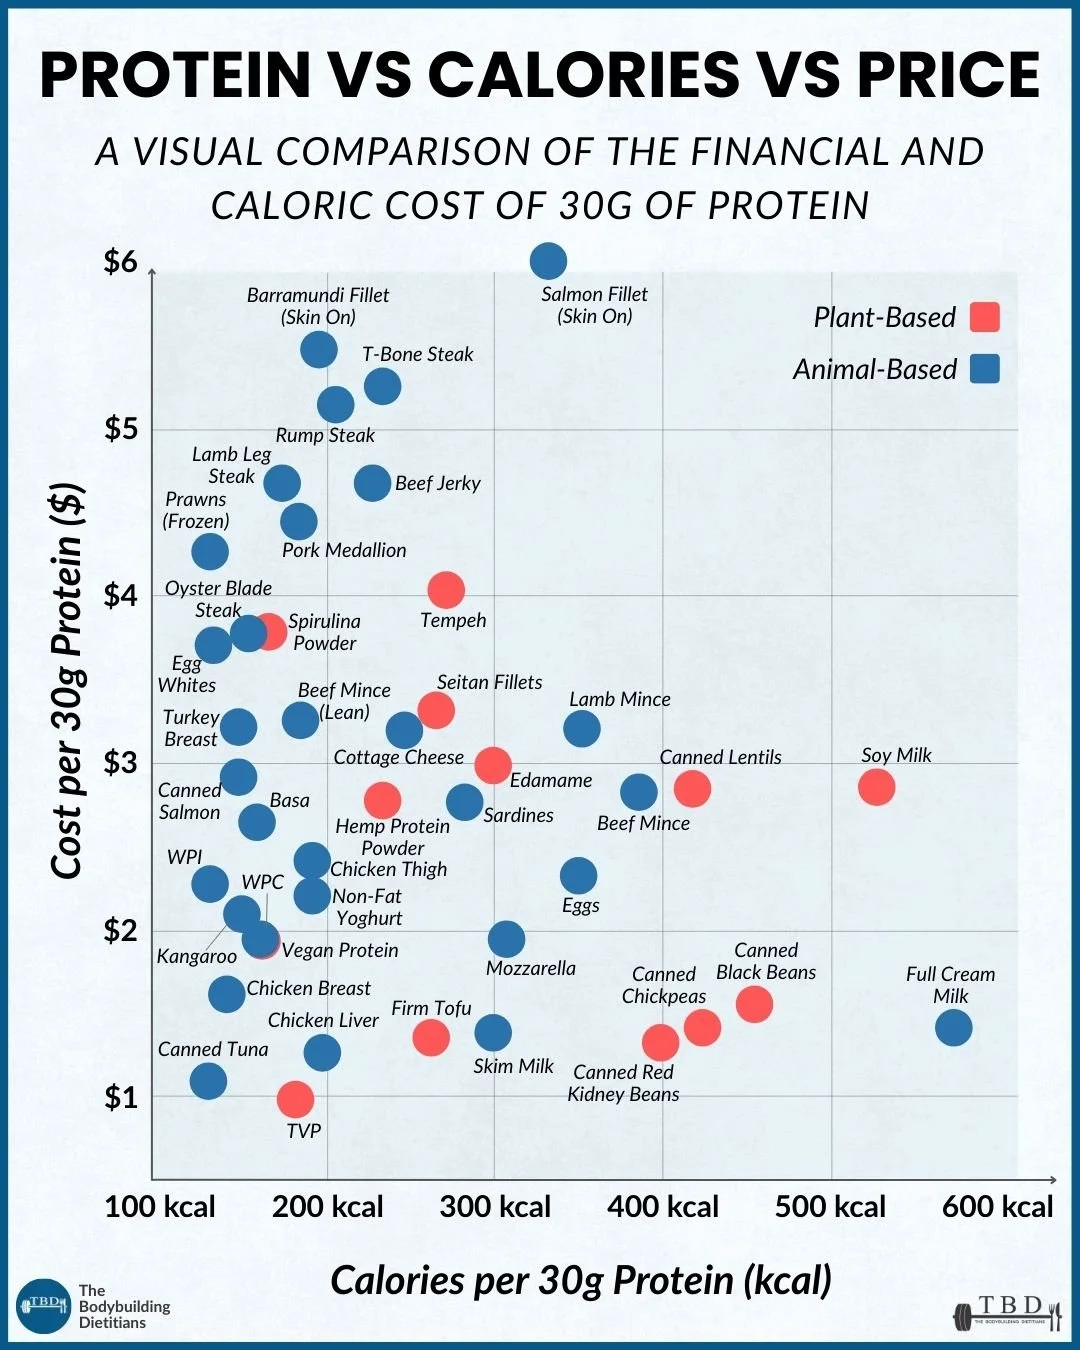
A Visual Comparison of the Financial and Caloric Cost of 30g of Protein
Protein is one of the most commonly prioritised nutrients in modern diets, whether the goal is supporting muscle gain, maintaining lean mass during weight loss, or simply improving satiety across the day.
While discussions about protein often focus on daily intake targets, there are two practical variables that shape real-world food choices: calorie cost and financial cost.
This visual comparison maps a range of commonly purchased protein foods across those two dimensions. Each point on the chart represents the approximate calories and cost required to obtain ~30 grams of protein from that food.
How to Interpret the Graph
The chart is organised along two axes:
Horizontal axis: Calories required for ~30g protein
Foods further to the left provide 30g of protein with fewer calories.
Vertical axis: Cost required for ~30g protein
Foods positioned lower on the graph provide that protein at a lower financial cost.
Together, these axes create a simple visual framework that shows how different protein sources cluster across the landscape.
Some foods are calorie-efficient but relatively expensive. Others are financially efficient but require a larger caloric investment. Many commonly eaten foods sit somewhere between those two extremes.
The goal of the graph is not to determine which foods are “best,” but to illustrate the trade-offs that naturally exist between energy density, protein density, and cost.
Calorie Efficiency: Lean Animal Proteins Cluster Together
One pattern that becomes clear when viewing the graph is how tightly many lean animal proteins cluster on the calorie axis.
Foods such as:
Chicken breast
Lean beef mince
Turkey breast
Canned tuna
Egg whites
Low-fat dairy products
tend to provide approximately 30 grams of protein for roughly 120–200 kcal, depending on fat content.
This reflects their high protein density relative to carbohydrate and fat content. In practical terms, this means they allow individuals to increase protein intake without significantly increasing total calorie intake.
For people managing body weight while prioritising protein intake, this calorie efficiency can be helpful when structuring meals.
Financial Efficiency: Budget-Friendly Protein Options
A separate pattern emerges when looking at financial cost.
Some protein sources provide a relatively inexpensive pathway to reaching protein targets, including:
Canned tuna
Chicken breast or thighs
Eggs
TVP (textured vegetable protein)
Tofu
Canned legumes
These foods tend to sit lower on the chart, indicating a lower cost per 30 grams of protein.
Budget-friendly options often share two characteristics:
They are produced at scale, making them widely accessible.
They are minimally processed, reducing production costs.
For individuals trying to maintain a higher protein intake within a grocery budget, these foods can form a practical foundation.
Plant Protein Sources and Caloric Investment
Another pattern visible in the chart relates to the caloric cost of plant-based protein sources.
Many plant proteins require a slightly larger caloric intake to reach the same protein amount, particularly when the food contains significant carbohydrate or fat alongside protein.
For example:
Legumes such as lentils or chickpeas
Beans
Soy milk
Certain plant protein foods
often sit further to the right of the graph, meaning more calories are required to obtain 30 grams of protein.
This is simply a reflection of their nutrient composition. Plant foods frequently provide a combination of carbohydrates, fibre, micronutrients, and plant compounds alongside protein.
Interestingly, soy-based foods and legumes often occupy a middle ground, offering a balance between cost efficiency and moderate calorie investment.
Foods That Sit at the Higher-Cost End
At the upper end of the chart are foods that provide protein efficiently but at a higher financial cost.
These include:
Fresh fish fillets such as salmon or barramundi
Steak cuts such as T-bone or rump
Certain seafood options
Specialty products like jerky
These foods can still play valuable roles in a varied diet, particularly due to their micronutrient profiles or fatty acid composition. The graph simply highlights that they tend to require a larger financial investment per gram of protein.
Why Price and Calories Are Only Part of the Picture
Although calorie efficiency and price are practical considerations, protein choices are rarely made based on those factors alone.
Food selection is shaped by many other variables, including:
Taste preferences
Cultural and family eating patterns
Cooking methods and convenience
Micronutrient density
Dietary patterns such as vegetarian or pescatarian diets
Environmental or ethical considerations
For example, fatty fish may appear higher on the price axis but provide omega-3 fatty acids. Legumes may require more calories per gram of protein but contribute fibre and plant diversity.
The goal of this comparison is simply to add another lens that helps contextualise everyday food decisions.
Data Sources and Methodology
To generate this comparison:
Pricing data was collected from the Woolworths online grocery store to reflect typical retail prices available to Australian consumers.
Nutrient values were sourced from the Australian Food Composition Database.
Where possible, foods were selected to represent what an average consumer is most likely to purchase rather than niche or specialty products.
Prices and nutrient values may vary between brands, preparation methods, and seasonal pricing fluctuations. As such, the chart should be interpreted as a general comparison rather than an exact calculation.
Putting the Information into Practice
For most people, an effective approach is to combine a range of protein sources that provide different benefits.
A balanced protein strategy might include:
Lean animal proteins for calorie efficiency
Budget-friendly staples for cost control
Plant-based sources for fibre and dietary diversity
Whole-food options that contribute micronutrients
Over time, these combinations allow individuals to meet protein targets while maintaining flexibility and variety within their diet.
If you want help structuring your diet so that protein intake, calories, and food budget all work together, personalised nutrition coaching can make the process far simpler.
You can learn more about coaching or book a consultation to discuss your goals.