A scatterplot of over 50 foods across five food categories, mapping grams of food and grams of fibre per 100 calories to identify which options best support satiety, gut health, and fibre targets simultaneously.
Foods that rank highest on both food volume and fibre per calorie offer the most practical combination of satiety and fibre contribution within a limited calorie budget. Kale, silverbeet, asparagus, and green beans sit furthest to the right on the fibre axis while maintaining very high food volume, making them the most efficient options per calorie across the chart. Raspberries, guava, and passionfruit lead among fruit. Legumes including black beans, lentils, and kidney beans provide a meaningful combination of fibre and food volume per calorie and sit in the practical mid-right zone. Nuts and seeds including chia seeds, sesame seeds, and pistachios provide high fibre per calorie but low food volume, reflecting their energy density. All values reflect ready-to-eat weights sourced from the Australian Food Composition Database.
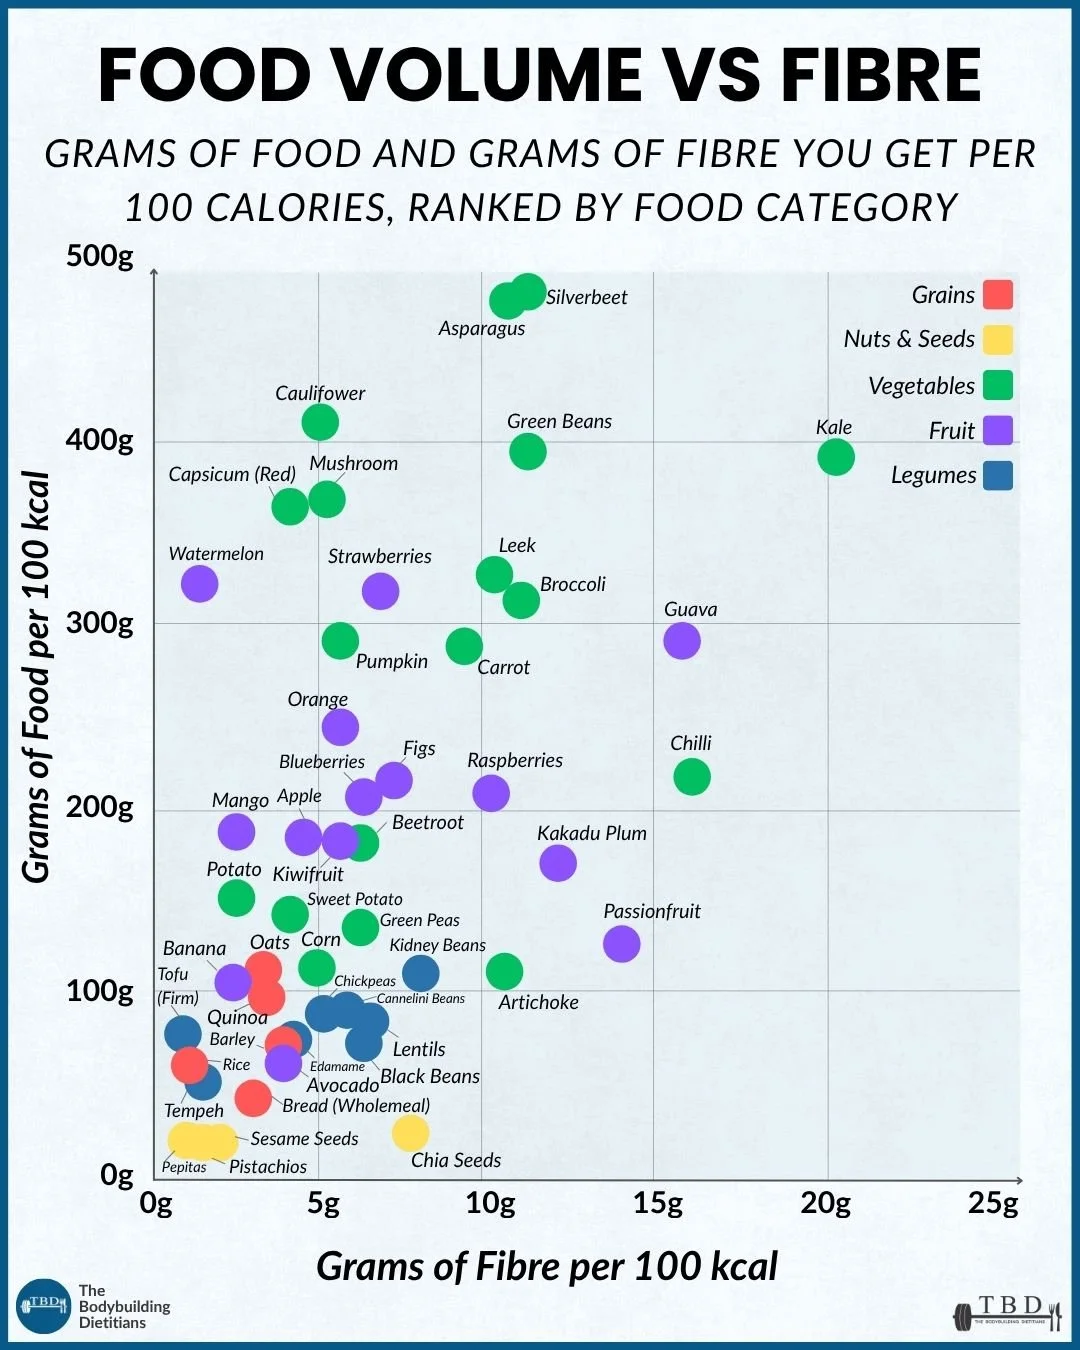
Grams of food and grams of fibre per 100 calories across over 50 foods from five food categories. Foods in the upper-right deliver both high volume and high fibre per calorie. All values reflect ready-to-eat weights unless otherwise noted.
The foods that rank highest for fibre per calorie are not always the ones that come to mind first. Chia seeds are often cited as a leading fibre source, and technically they are, but at approximately five grams of food volume per 100 calories, they are one of the smallest food masses on this chart per calorie spent. Kale, by contrast, sits toward the extreme right on the fibre axis while providing close to 400 grams of food mass per 100 calories. For someone trying to manage hunger and reach fibre targets within a calorie deficit, these two foods present very different practical propositions.
This scatterplot is the companion to the food volume versus protein chart published previously, and it uses the same two-axis structure. The y-axis shows how much food, in grams, 100 calories provides. The x-axis shows how many grams of fibre those same 100 calories deliver. Foods in the upper right of the chart do both simultaneously: they provide meaningful food volume and meaningful fibre per calorie, which makes them the most efficient options when both satiety and fibre contribution are priorities.
All values reflect ready-to-eat weights. Vegetables and fruit are raw. Grains and legumes are cooked, with legumes reflecting boiled or canned values where applicable. Chia seeds are measured dry, which is how they are typically used. Data is sourced from the Australian Food Composition Database.
What Do the Two Axes Tell You in This Context?
The y-axis measures energy density expressed in reverse: a higher value means more food mass per calorie, which generally corresponds to more physical volume in the stomach, a stronger satiety signal, and a lower calorie cost for the same eating experience. Foods at the top of the y-axis are the most calorie-efficient for filling the stomach.
The x-axis measures fibre efficiency: how many grams of dietary fibre are delivered per 100 calories consumed. A higher x-axis value means more fibre for a given calorie investment. This is the dimension most directly relevant to gut health, microbiome diversity, glycaemic management, and the satiety that fibre specifically contributes through slowing gastric emptying and promoting the hormonal signals associated with fullness.
Dietary fibre is the indigestible carbohydrate component of plant foods. It encompasses both soluble fibre, which forms a gel in the digestive tract and supports glycaemic management and cholesterol reduction, and insoluble fibre, which adds bulk and supports bowel regularity. The combination of fibre types provided by a varied plant food intake is more functionally comprehensive than any single fibre source can offer, which is one reason the chart includes foods across all five plant food categories.
Together, the two axes identify foods that are practical for the dual goal of managing calorie intake while also meeting or exceeding daily fibre targets of 30 grams for males and 25 grams for females. The research on fibre and health, including the Reynolds et al. Lancet meta-analysis, consistently supports the value of reaching and exceeding these targets, and the chart provides a practical map for doing so efficiently within a calorie budget.
Which Vegetables Rank Highest for Both Dimensions?
Vegetables dominate the upper-right region of the chart, which is consistent with what is known about their low energy density and meaningful fibre content. What the chart makes visible is that not all vegetables are equivalent, and the variation within the category is substantial.
Kale sits furthest to the right on the fibre axis among vegetables at approximately 20 grams of fibre per 100 calories, while maintaining a food volume of approximately 390 grams per 100 calories. This combination is exceptional. Kale belongs to the brassica family and provides not only high fibre but also glucosinolates including sulforaphane precursors, vitamin C, vitamin K, folate, and calcium. It is one of the more nutritionally dense vegetables available across multiple dimensions simultaneously.
Silverbeet and asparagus sit at the top of the y-axis at approximately 470 and 460 grams of food per 100 calories respectively, with respectable fibre contributions. Their extreme volume-to-calorie ratio reflects their very high water content, and both provide meaningful micronutrients including folate, potassium, and vitamin K alongside their fibre.
Green beans sit toward the upper-right at approximately 400 grams volume and 10 grams of fibre per 100 calories, making them one of the more practical high-volume, high-fibre vegetables available in terms of accessibility and versatility across different meal types.
Broccoli, leek, and carrot sit in the mid-upper-right zone, providing moderate fibre per calorie alongside high food volume. Broccoli's position is reinforced by its sulforaphane content, making it among the more nutritionally multidimensional options in the chart regardless of its fibre ranking alone.
Cauliflower, mushroom, and capsicum provide the highest food volume per calorie in the chart after silverbeet and asparagus, but sit further left on the fibre axis than kale or green beans. They are more useful for volume than for fibre contribution specifically, though they remain practical components of a high-fibre dietary pattern.
Potato and corn sit considerably further left and lower than the leafy and cruciferous vegetables, reflecting their higher starch content relative to fibre. They are calorie-denser than other vegetables and provide proportionally less fibre per calorie. This does not make them nutritionally poor choices in a broader dietary context, but it does mean they are less efficient specifically for the dual goals this chart addresses.
Which Fruit Provides the Most Fibre Per Calorie?
Fruit clusters in the upper-middle zone of the chart, with meaningful variation between categories. The pattern mirrors what the high-fibre foods ranked article established: fruit with higher water content and lower sugar concentration per gram tends to sit further up and to the right.
Guava is the standout among fruit at approximately 300 grams of food volume and 15 grams of fibre per 100 calories. It is not commonly stocked in Australian supermarkets relative to its nutritional profile, but it provides a fibre efficiency that exceeds most other fruit considerably. Kakadu plum sits in a similar region and offers exceptional vitamin C content alongside its fibre position.
Raspberries sit at approximately 230 grams volume and 12 grams of fibre per 100 calories, which makes them one of the more practically accessible high-fibre fruits for everyday use. Their fibre-to-calorie position has been highlighted across several articles in this library and holds up consistently across different comparison frameworks.
Passionfruit sits lower on the volume axis but further right on the fibre axis than most other fruit at approximately 14 grams of fibre per 100 calories, reflecting its high seed-to-flesh ratio, which is where most of its fibre resides. It is a concentrated fibre source in a small food mass.
Strawberries, figs, blueberries, and kiwifruit sit in the mid-range of both axes, contributing meaningfully to both goals without dominating either. Figs sit further right than most other commonly eaten fruit, which is underappreciated given how accessible they are.
Watermelon, banana, and mango sit in the upper-left zone, providing high food volume per calorie but relatively low fibre per calorie. They are useful for volume and satiety but less efficient for fibre contribution per calorie than the right-side fruit options.
Where Do Legumes Sit and Why Are They Practical?
Legumes cluster in the middle section of the chart with moderate food volume and moderate-to-high fibre per calorie, which makes them one of the more practically useful categories for simultaneously managing hunger and meeting fibre targets within a calorie budget.
Black beans and lentils sit furthest to the right among legumes at approximately 10 to 11 grams of fibre per 100 calories, while providing around 60 to 70 grams of food volume per 100 calories. That volume figure is lower than vegetables and fruit, but the fibre contribution per calorie is considerably higher, and legumes also provide protein, resistant starch, and a range of micronutrients that vegetables and fruit typically do not at equivalent amounts.
Kidney beans, cannellini beans, and chickpeas sit at 7 to 9 grams of fibre per 100 calories with similar food volumes to the darker legumes. These are broadly interchangeable for practical purposes and all represent efficient fibre sources relative to their calorie cost.
Edamame sits in the mid-left of the legume cluster with slightly lower fibre per calorie, reflecting its higher water and protein content relative to other legumes. It is still a useful fibre source but less fibre-efficient per calorie than dried and cooked legumes.
Green peas sit higher on the volume axis than the other legumes due to their lower calorie density, providing more food mass per calorie alongside a moderate fibre contribution. They are closer to starchy vegetables than to dried legumes in their nutritional profile and cooking context.
The combination of fibre and protein that legumes provide makes them particularly useful during a calorie deficit, where satiety per calorie is a practical priority. Their fibre is predominantly soluble, which contributes meaningfully to the gut microbiome substrate diversity that research consistently associates with health benefit.
How Do Nuts, Seeds, and Grains Compare?
Nuts and seeds occupy the lower portion of the chart, which reflects their high energy density. They provide meaningful and in some cases exceptional fibre per calorie, but very low food volume per calorie, which means they contribute to fibre targets efficiently but contribute very little to stomach volume and satiety from a mechanical fullness perspective.
Chia seeds sit at the extreme right of the x-axis at approximately 25 grams of fibre per 100 calories, the highest fibre efficiency of any food on the chart, while sitting near the bottom of the y-axis at approximately five grams of food volume per 100 calories. This combination makes chia seeds exceptionally efficient as a concentrated fibre addition but essentially negligible in terms of food volume. A tablespoon added to yoghurt or oats contributes several grams of fibre for minimal caloric cost and negligible food mass, which is their primary practical use case.
Sesame seeds and pistachios sit to the left of chia seeds on the fibre axis and similarly low on the volume axis, reflecting the general pattern of energy-dense foods: high fibre efficiency but low volume per calorie.
Pepitas sit in the extreme lower-left, providing the lowest food volume per calorie of anything on the chart with modest fibre contribution, reflecting their very high energy density from fat content.
Grains including oats, barley, quinoa, and rice cluster in the low-volume, low-to-moderate fibre zone. Barley sits furthest right among grains at approximately four to five grams of fibre per 100 calories, reflecting its higher beta-glucan content relative to other grains. Oats sit nearby. Rice sits at the far left of the grain cluster with the lowest fibre contribution per calorie.
Wholemeal bread sits in a similar position to the cooked grains, which is worth noting for context: a gram-for-gram comparison with vegetables or legumes shows wholemeal bread as considerably less fibre-efficient per calorie, even though it is often perceived as a high-fibre food. In absolute terms, two slices contribute meaningfully to daily targets, but per calorie it sits considerably lower than the plant foods in the right half of the chart.
How Should This Chart Inform Food Selection?
The practical value of this chart lies in identifying which foods serve both satiety and fibre goals simultaneously, and which serve one without contributing meaningfully to the other.
During a fat loss phase, where the priority is managing hunger within a calorie deficit while meeting fibre targets, the upper-right zone of the chart represents the most efficient food choices. Combining leafy and cruciferous vegetables for volume and fibre, using legumes for fibre alongside protein, and including raspberries, guava, or strawberries for fibre-rich fruit that also provides volume, covers the practical basis for a high-fibre, high-volume approach to eating within a deficit.
Nuts and seeds remain useful additions despite their low volume per calorie. Their concentrated fibre contribution means a small serving adds meaningfully to daily totals, and their other nutritional properties including healthy fats and micronutrients make them worth including. The key is understanding that they contribute to fibre targets without contributing to the food volume that drives mechanical satiety, which means they pair well with high-volume foods rather than substituting for them.
Starchy vegetables, bananas, and rice-based grains are useful carbohydrate sources for training fuelling and glycogen replenishment, and their lower position on the fibre efficiency axis does not make them poor food choices overall. Understanding their position on the chart is useful context for how they contribute to the dietary goals this framework addresses, which is simply fibre and volume per calorie rather than a comprehensive nutritional assessment.
How food selection is structured around fibre, volume, calorie targets, and digestion for a specific person and phase is a central part of how we approach dietary planning with coaching clients, where the goal is always to find the combination of foods that achieves the right nutritional outcome within a dietary pattern the person can actually sustain.
Practical Takeaways
Foods in the upper-right of the chart deliver both high food volume and high fibre per 100 calories. Leafy and cruciferous vegetables, particularly kale, silverbeet, asparagus, green beans, and broccoli, are the most efficient options across both dimensions.
Not all vegetables are equivalent on this chart. Leafy greens and cruciferous vegetables sit dramatically further right on the fibre axis than starchy vegetables like potato and corn, which deliver considerably less fibre relative to their calorie content.
Raspberries, guava, and passionfruit rank highest among fruit for fibre per calorie. Watermelon and banana provide high volume per calorie but relatively low fibre.
Legumes cluster in the mid-right zone, offering a practical combination of fibre and food volume per calorie that makes them particularly useful during a fat loss phase. Black beans and lentils rank highest within the category.
Nuts and seeds provide high fibre per calorie but low food volume, reflecting their energy density. Chia seeds sit at the extreme right on the fibre axis but provide negligible food volume. They contribute to fibre targets without contributing to mechanical fullness.
Grains sit in the lower-left zone with modest fibre per calorie. Barley and oats rank highest within the grain category. Cooked rice and refined grains sit at the far left.
All values reflect ready-to-eat weights sourced from the Australian Food Composition Database. Grains and legumes are cooked; vegetables and fruit are raw; chia seeds are measured dry.
Frequently Asked Questions
Which food has the most fibre per calorie?
Of the foods in this comparison, chia seeds provide the highest fibre per 100 calories at approximately 25 grams, but they also provide negligible food volume at around five grams of food mass per 100 calories. Among foods that also provide meaningful food volume, kale ranks highest at approximately 20 grams of fibre per 100 calories alongside approximately 390 grams of food mass per 100 calories, making it the most efficient option for simultaneously addressing fibre and satiety goals.
Are vegetables or fruit better for fibre per calorie?
Leafy and cruciferous vegetables including kale, silverbeet, asparagus, and green beans generally rank higher on fibre per calorie than most commonly eaten fruit. The exception is specific fruit varieties with high seed or skin fibre content, including guava, raspberries, and passionfruit, which sit further right on the fibre axis than many vegetables. In practical terms, a varied intake across both categories covers more micronutrient diversity than either alone.
Are legumes good sources of fibre for a calorie deficit?
Yes. Legumes sit in the mid-right zone of the chart, providing moderate food volume alongside meaningful fibre per calorie. Black beans and lentils rank highest within the category at approximately 10 to 11 grams of fibre per 100 calories. Their combination of fibre, protein, and resistant starch makes them particularly practical during a calorie deficit, where both satiety and protein targets require attention. Their food volume per calorie is lower than vegetables, but they contribute more fibre per calorie than most grains and more protein per calorie than most vegetables.
Why are nuts and seeds low on food volume despite being high in fibre?
Nuts and seeds are energy-dense: they deliver a large number of calories per gram of food mass due to their high fat content. This means that per 100 calories, the food mass they provide is very small, even though their fibre content per gram of food is reasonable. Chia seeds are the most extreme example, providing approximately 25 grams of fibre per 100 calories in a food mass of only around five grams. They are efficient fibre sources when used as concentrated additions to meals, but they do not contribute to food volume or mechanical satiety in the way that high-water-content vegetables do.
Does cooking vegetables reduce their fibre content?
Cooking modestly changes the physical structure of fibre in vegetables without substantially reducing total fibre content. The insoluble fibre in most vegetables survives cooking largely intact, though softening of cell walls can alter how quickly it moves through the digestive tract. Raw vegetables are used in this comparison to reflect the standard AFCD reporting convention and because raw preparation is the more common eating state for most of the vegetables included. In practice, the choice between raw and cooked vegetables has a negligible effect on total daily fibre contribution relative to the choice of which vegetables to include.
How do I use this chart to hit 30 grams of fibre per day?
A practical approach is to build meals around the foods in the upper-right zone, which contribute meaningfully to both fibre and food volume simultaneously. A day that includes a large serve of cooked legumes at lunch contributing around eight to ten grams of fibre, a large serve of mixed green vegetables at dinner contributing six to eight grams, a serve of raspberries or strawberries contributing three to five grams, a tablespoon of chia seeds added to yoghurt or oats contributing four to five grams, and oats at breakfast contributing three to four grams reaches the 30-gram target comfortably within a normal eating pattern.
If you want support structuring food selection around fibre, volume, calorie targets, and your specific phase and goals, our team works through exactly this kind of practical dietary planning with every client.