A scatterplot of over 40 foods across six food categories, mapping grams of food and grams of protein per 100 calories to identify which options best support hunger management and protein targets simultaneously.
Foods that rank highest on both food volume and protein per calorie are the most practical options for managing hunger and meeting protein targets during a fat loss phase. Egg whites, chicken breast, whiting, prawns, and kangaroo rank highest on protein per 100 calories among animal foods. Vegetables such as cauliflower, mushroom, broccoli, and capsicum provide the highest food volume per calorie but contribute minimal protein. Lean animal proteins and low-fat dairy options occupy the top-right of the chart, delivering both meaningful volume and high protein per calorie, making them the most efficient food choices when both hunger management and protein targets are priorities. All values in this comparison use hydrated or ready-to-eat weights, sourced from the Australian Food Composition Database.
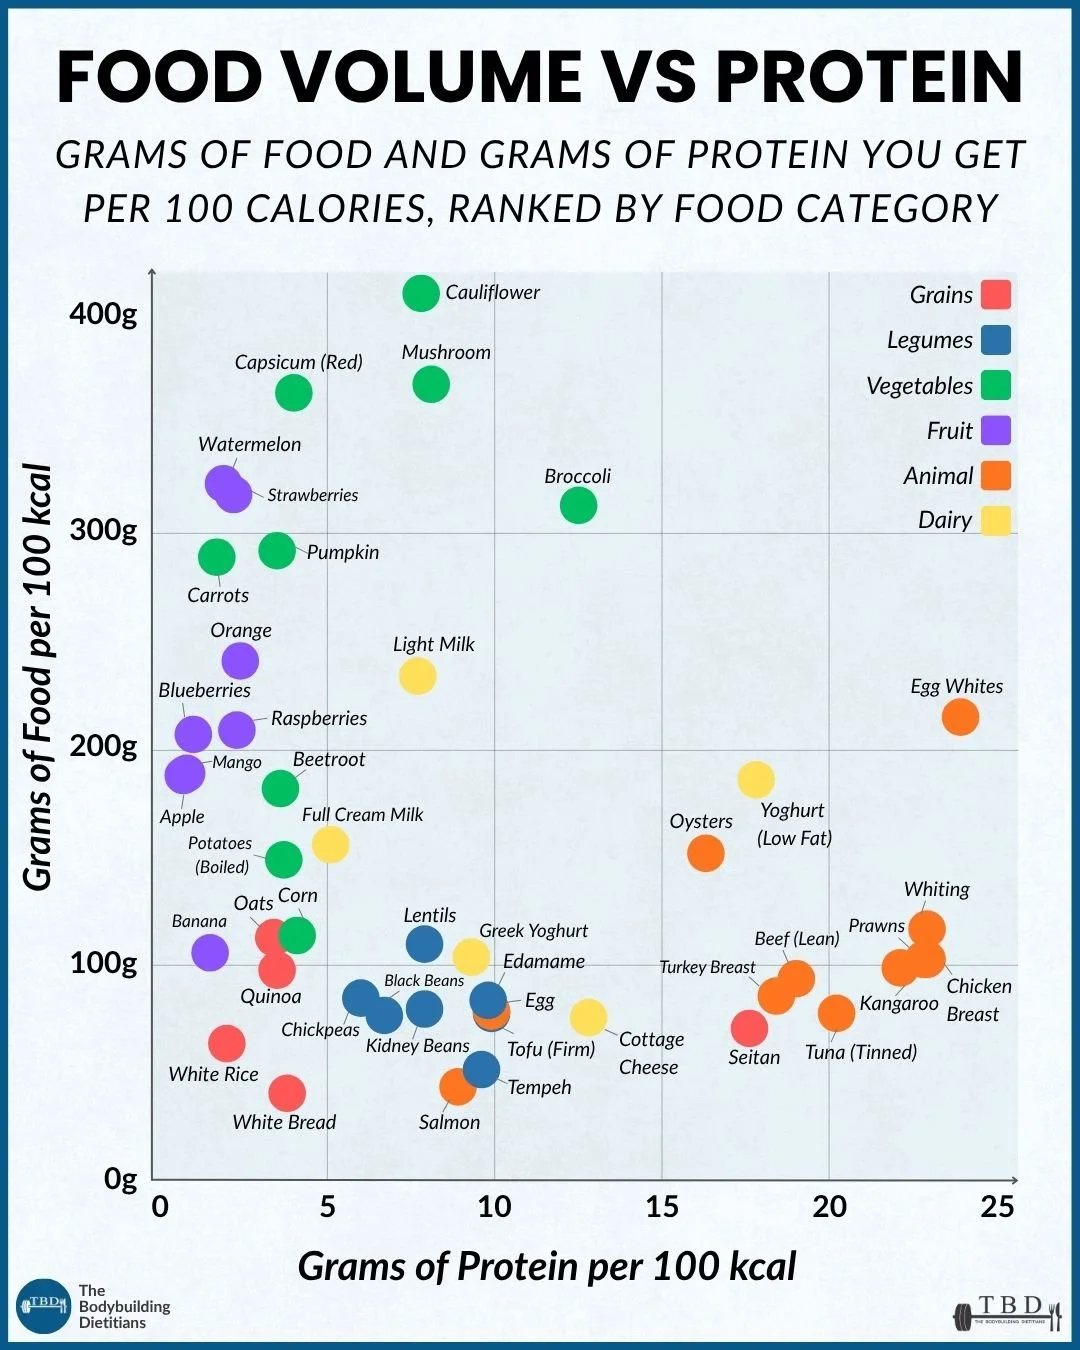
Grams of food and grams of protein per 100 calories across over 40 foods from six food categories. Foods in the upper-right deliver both high volume and high protein per calorie. All values use hydrated or ready-to-eat weights.
Most food comparisons look at one variable at a time. Protein content per 100 grams is useful. Calorie density is useful. But the two together tell a more complete story, and the combination is particularly relevant for anyone managing a calorie deficit while trying to maintain adequate protein and control hunger.
This scatterplot maps two variables simultaneously across over 40 foods from six food categories. The y-axis shows how much food, in grams, 100 calories buys you. The x-axis shows how many grams of protein those same 100 calories deliver. Foods that sit in the top right of the chart are the most efficient options for someone who needs both volume and protein: they keep you full and they contribute meaningfully to daily protein targets without using a disproportionate share of the calorie budget to do so.
All values use hydrated or ready-to-eat weights. Cooked weights are used for grains and legumes, and raw weights for meats, fish, vegetables, and fruit. Data is sourced from the Australian Food Composition Database.
What Do the Two Axes Actually Tell You?
The y-axis, grams of food per 100 calories, is a measure of energy density expressed in reverse. A food with a high y-axis value gives you more food weight for the same calorie cost, which tends to mean more physical volume in the stomach, a stronger stretch signal, and a longer-lasting sense of fullness. Foods with low y-axis values are calorie-dense: a small amount of food delivers a large number of calories, which means the total volume eaten for a given calorie budget is lower.
Energy density refers to the number of calories a food provides relative to its weight or volume. High water and fibre content are the primary determinants of low energy density, which is why vegetables and fruit cluster at the top of the y-axis despite being quite different nutritionally in other respects.
The x-axis, grams of protein per 100 calories, measures how efficiently a food delivers protein within its calorie cost. A food with a high x-axis value provides a large amount of protein for each calorie consumed. This dimension is particularly useful for identifying foods that contribute to protein targets without disproportionately increasing total calorie intake, which is the core challenge of high-protein dieting in a deficit.
Together, the two axes identify four practical zones. Top-right foods are high volume and high protein per calorie, the optimal zone for fat loss with protein retention. Bottom-right foods are lower volume but still high protein per calorie, meaning they are efficient protein sources but less useful for hunger management. Top-left foods are high volume but low protein per calorie, making them useful for satiety and micronutrient intake but not protein contribution. Bottom-left foods are low volume and low protein per calorie, meaning they are calorie-dense without a strong return in either satiety or protein.
Which Foods Sit in the Top Right?
The top-right zone of the chart is where lean animal proteins and low-fat dairy options cluster, and these are the foods that most efficiently address both goals simultaneously during a fat loss phase.
Egg whites sit furthest to the right on the protein axis at approximately 25 grams of protein per 100 calories, while also maintaining a meaningful food volume at around 220 grams per 100 calories. This combination makes egg whites one of the most efficient protein sources available when both protein density and volume are valued. They are effectively pure protein with minimal fat or carbohydrate content, which accounts for the extreme position on the protein axis.
Chicken breast, whiting, prawns, kangaroo, and tinned tuna cluster at the high end of the protein axis with moderate food volume, all delivering 20 to 25 grams of protein per 100 calories. These foods are the practical workhorses of a high-protein diet during a fat loss phase. They provide meaningful protein contribution for a relatively small calorie investment, and their volume per calorie, while lower than vegetables, is still reasonable relative to other protein sources.
Lean beef and turkey breast sit slightly to the left of the leanest options, reflecting a modestly higher fat content that slightly reduces the protein-to-calorie ratio without meaningfully affecting their practical utility as protein sources.
Low-fat yoghurt and cottage cheese occupy a middle-right position, providing solid protein per calorie alongside a meaningful food volume, which makes them practical options for satiety-conscious protein sourcing across both meals and snacks.
Where Do Vegetables and Fruit Sit, and Why?
Vegetables dominate the upper left of the chart, delivering exceptional food volume per calorie but very little protein. Cauliflower sits at the highest point on the y-axis at approximately 420 grams of food per 100 calories, followed closely by mushroom at around 370 grams, capsicum at around 360 grams, and broccoli at around 310 grams. The volume these foods provide for their calorie cost is unmatched by any other food category.
The practical implication is clear: vegetables are one of the most effective tools available for filling the stomach and extending satiety during a calorie deficit, without meaningfully competing with other foods for calorie budget space. A 200-gram serve of cauliflower contributes approximately 50 calories. A 200-gram serve of broccoli contributes around 65 calories. These are meaningful volumes that occupy real space and generate the stretch response that contributes to fullness, at a caloric cost that is almost negligible within a structured meal plan.
Vegetables provide minimal protein per calorie, which means they cannot substitute for protein sources. Their role in a fat loss diet is complementary: they add volume and micronutrients, support satiety, and contribute dietary fibre, all without significantly affecting the calorie budget or macronutrient targets.
Fruit clusters in a similar position to vegetables on the y-axis, with watermelon, strawberries, and raspberries among the highest-volume fruits per calorie, reflecting their high water content. Fruit provides more carbohydrate and natural sugar than vegetables, which places it slightly to the right on the protein axis in cases where the natural amino acid content of some fruits is non-trivial, but it remains a low-protein food category overall.
Where Do Legumes Sit and Are They Useful Protein Sources?
Legumes occupy the middle section of the chart, clustered with moderate food volume and moderate protein per calorie. Lentils, black beans, chickpeas, kidney beans, and edamame all sit in a band of approximately 7 to 10 grams of protein per 100 calories, with food volumes ranging from around 70 to 120 grams per 100 calories.
Compared to lean animal proteins, legumes provide meaningfully less protein per calorie. However, they contribute both protein and a significant fibre load within their calorie cost, and they deliver more food volume than the dense protein sources that sit to their right on the x-axis. For individuals who do not eat animal protein or who want to diversify protein sources, legumes are a useful and cost-effective contributor.
Edamame sits furthest to the right among the legumes at around 10 grams of protein per 100 calories, reflecting the higher protein density of soybeans relative to other legumes. Firm tofu and tempeh sit in a similar position to legumes on the chart and are worth noting as the most protein-efficient plant-based options outside of edamame, though they remain well to the left of lean animal proteins on the protein axis.
One practical consideration with legumes as a protein source is that their protein is not complete, meaning they do not provide all essential amino acids in the proportions required by human physiology when consumed in isolation. Combining legumes with grains or other plant protein sources addresses this, and within a varied diet the practical significance of incomplete protein is modest.
Where Do Grains and Dairy Sit?
Grains cluster in the lower-left to mid-left section of the chart, with white rice, white bread, quinoa, oats, and corn all providing moderate food volume and low to moderate protein per calorie. Quinoa sits furthest to the right among grains at around 4 to 5 grams of protein per 100 calories, reflecting its comparatively higher protein content relative to other grains. Oats sit nearby. White rice and white bread sit toward the lower-left of the grain cluster, providing reasonable food volume but low protein per calorie relative to most other options.
Grains are primarily carbohydrate sources, and their role in a performance-oriented diet is predominantly as a vehicle for glycogen replenishment rather than protein contribution. Their position on the chart reflects this: they are neither leaders on volume nor on protein, but they serve a specific and important function that the chart's two-axis framework does not fully capture.
Full cream milk sits in the middle of the chart at moderate volume and moderate protein, while light milk moves upward on the volume axis and rightward on the protein axis, reflecting the shift in caloric composition when fat is reduced. Greek yoghurt sits close to the legume cluster with solid protein per calorie and moderate volume, and is one of the more practically useful dairy options for protein-conscious eating.
Salmon sits in the lower-right section, providing high protein per calorie but lower food volume per calorie relative to leaner fish, reflecting its higher fat content. Eggs sit in a similar position to salmon, with meaningful protein but lower volume per calorie due to their fat content.
How Should This Chart Inform Food Selection?
The practical value of this chart is not in selecting only top-right foods and eliminating everything else. It is in understanding where the foods you currently rely on sit, and making deliberate adjustments based on what your current goals require.
During a fat loss phase, where the priority is maintaining protein targets and managing hunger within a reduced calorie budget, the chart's implications are direct: prioritising lean animal proteins and low-fat dairy for protein, and using vegetables generously for volume and satiety, produces the most efficient outcome per calorie. Foods in the bottom-left of the chart, which are calorie-dense with low volume and low protein per calorie, require the most careful portioning in a deficit because they consume a large share of the calorie budget with a modest return in satiety or protein.
During a muscle gain or maintenance phase, calorie density becomes less of a constraint, and the x-axis protein efficiency is the more relevant dimension. Foods to the right of the chart, regardless of their y-axis position, are the most efficient contributors to daily protein targets. The calorie-dense options in the bottom-left become more useful when the goal is to reach a calorie surplus without relying on enormous food volume.
Understanding where your current food choices sit on this chart, and adjusting selection based on your phase and goals, is a practical skill that compounds over time. For individuals who want support applying this framework to their specific dietary pattern and training context, our coaching approach works through exactly this kind of food selection calibration as part of the nutritional setup process.
What Does This Chart Show About the Protein-to-Calorie Trade-Off?
One of the clearest patterns visible in the chart is the trade-off between protein content and food volume across food categories. The foods that provide the most protein per calorie tend to be the leanest animal protein sources, and they sit relatively low on the volume axis compared to vegetables. Conversely, the foods that provide the most volume per calorie are predominantly vegetables and fruit, which contribute very little protein.
This trade-off means that a diet optimised purely for maximum protein per calorie will necessarily provide lower food volume than one that prioritises vegetables and fruit. In practice, the most effective dietary structures during a fat loss phase address this by combining lean protein sources from the right side of the chart with high-volume, low-calorie vegetables from the upper-left, achieving both goals within the same meal rather than choosing between them.
A meal built around chicken breast, a large serve of cauliflower and broccoli, and a modest serve of quinoa, for example, would sit toward the upper-right in aggregate: meaningful protein, high food volume, moderate calorie cost. This structural thinking, rather than individual food optimisation, is how the chart is most usefully applied.
Practical Takeaways
Foods in the upper-right of the chart deliver both high food volume and high protein per 100 calories, making them the most efficient options for managing hunger and meeting protein targets simultaneously during a fat loss phase.
Lean animal proteins including egg whites, chicken breast, whiting, prawns, kangaroo, and tinned tuna provide the highest protein per 100 calories of any food category, ranging from approximately 20 to 25 grams of protein per 100 calories.
Vegetables dominate the high-volume, low-protein zone of the chart. Cauliflower, mushroom, capsicum, and broccoli provide 300 to 420 grams of food per 100 calories, making them the most calorie-efficient tools for satiety and meal volume.
Legumes provide moderate volume and moderate protein per calorie, alongside meaningful fibre. They are useful contributors in plant-forward diets but sit well below lean animal proteins in protein efficiency per calorie.
Grains are primarily carbohydrate sources and sit in the moderate-volume, low-protein zone. Their primary role is glycogen support rather than protein contribution.
During a fat loss phase, combining lean protein sources from the right side of the chart with high-volume vegetables from the upper-left achieves both satiety and protein targets within a controlled calorie budget.
During a muscle gain phase, the protein efficiency axis becomes the more relevant dimension. Calorie-dense foods from the lower-left become more useful as tools for reaching a surplus without requiring extreme food volume.
All values use hydrated or ready-to-eat weights sourced from the Australian Food Composition Database, which is relevant for interpreting cooked grain and legume values relative to their dry counterparts.
Frequently Asked Questions
What food has the most protein per calorie?
Egg whites provide the highest protein per calorie of any food in this comparison at approximately 25 grams of protein per 100 calories. Other lean animal proteins including chicken breast, whiting, prawns, kangaroo, and tinned tuna follow closely, all providing approximately 20 to 25 grams of protein per 100 calories.
Which vegetables are most filling per calorie?
Cauliflower, mushroom, capsicum, broccoli, and pumpkin rank highest on food volume per 100 calories among vegetables. Cauliflower sits at the top at approximately 420 grams of food per 100 calories, followed by mushroom at approximately 370 grams and capsicum at approximately 360 grams. The high water and fibre content of these foods is what drives their low energy density.
Are legumes good protein sources compared to animal foods?
Legumes provide moderate protein per calorie, ranging from approximately 7 to 10 grams of protein per 100 calories depending on the specific food. This is meaningfully lower than lean animal proteins, which deliver 20 to 25 grams per 100 calories. Legumes are useful contributors in diverse or plant-forward diets and provide fibre alongside their protein, but they are not as protein-efficient per calorie as lean animal sources. Edamame and firm tofu rank highest among plant-based options in this comparison.
How does food volume affect fat loss?
Food volume affects fat loss primarily through its impact on satiety. Foods that provide more physical weight and bulk per calorie occupy more space in the stomach, generate a stronger stretch signal to the brain, and slow gastric emptying, all of which extend the period of post-meal fullness and reduce the likelihood of subsequent overeating. Prioritising high-volume, lower-calorie foods during a deficit makes the experience of eating less food considerably more manageable without requiring extreme willpower.
Why is salmon lower on the protein axis than chicken breast?
Salmon contains a significant amount of dietary fat alongside its protein, which increases its caloric content per gram and therefore reduces the protein delivered per 100 calories relative to leaner protein sources. Salmon provides approximately 11 to 13 grams of protein per 100 calories compared to chicken breast's approximately 24 grams. Salmon's fat content is nutritionally valuable, particularly for its omega-3 fatty acid contribution, but it means it is less efficient than lean proteins as a vehicle for hitting protein targets within a tight calorie budget.
Are all values in this chart based on cooked or raw weights?
Values use hydrated or ready-to-eat weights throughout. This means cooked weights are used for grains and legumes, where water absorption during cooking significantly increases weight, and raw weights are used for meats, fish, vegetables, and fruit. This ensures the comparison reflects realistic serving portions rather than dry ingredients that would misrepresent how much food 100 calories actually provides in a real eating context.
If you want support applying this kind of food selection framework to your specific calorie targets, protein goals, and training phase, our team works through exactly this level of practical detail with every client.