Almost every food carries all three macronutrients, not just one. This is a visual reference showing how protein, carbohydrate, and fat actually distribute across common protein sources, carbohydrate sources, and fat sources, with the practical implications for building meals around specific calorie and macro targets.
Foods are typically filed into single macronutrient categories (bread as carbs, steak as protein, peanut butter as fat), but almost every whole food delivers meaningful amounts of at least two macronutrients, and often all three. This matters when building a diet around specific goals because the distribution within each food shapes both the calorie contribution and the compatibility with other meal components. Within protein sources, chicken breast and low-fat yoghurt deliver protein with minimal fat or carbohydrate, while whole eggs and salmon bring substantial fat alongside their protein, and legumes like lentils and quinoa deliver meaningful carbohydrate alongside their protein. Within carbohydrate sources, table sugar and honey approach pure carbohydrate, while oats, chickpeas, and quinoa deliver meaningful protein and fat alongside their carbohydrate content. Within fat sources, olive oil is essentially pure fat, while nuts, seeds, dark chocolate, and cheese contribute meaningful protein and some carbohydrate alongside the fat. Understanding the actual distribution supports better food selection during fat loss (where lower-fat versions of protein sources create budget for other foods), muscle gain (where higher-density options make hitting calorie targets more practical), and general dietary variety.
Foods are typically filed into single macronutrient categories. Bread is a carbohydrate, steak is a protein, peanut butter is a fat. The shorthand is fine for quick decisions and general meal planning, but every one of those foods delivers more than its headline macro, and the distribution within each food shapes how it fits into a diet built around specific calorie and macronutrient targets.
The three charts in this article show the actual distribution across common protein sources, carbohydrate sources, and fat sources. Foods within the same category vary widely in energy density and in how much of the other two macros they carry. Understanding this variation makes food selection more precise, particularly during specific goals (fat loss, muscle gain, contest prep) where the difference between a lean protein source and a mixed protein and fat source can meaningfully shape whether the day's macros work as intended.
This article is designed as a reference rather than a tutorial. The charts show the distribution, the sections walk through what the pattern means for practical food selection, and the closing section addresses how to use the reference to build a broader food library that supports both macro targets and dietary diversity.
Why Does It Matter That Every Food Carries Multiple Macronutrients?
Single-category thinking about food is convenient and often useful, but it can lead to two specific errors when building a diet around targeted macronutrient intakes.
The first error is underestimating the calorie contribution of the "other" macros. A lifter thinking of eggs as a "protein source" may not fully account for the substantial fat contribution that comes alongside the protein. A lifter thinking of oats as a "carbohydrate" may not register that a large oat serving delivers 5 to 10 grams of fat and meaningful protein alongside the starch. When these unaccounted contributions accumulate across several meals per day, the total calorie intake and macro distribution can drift meaningfully from the intended plan.
The second error is failing to use the distribution as a food selection tool. Once the actual distribution is clear, food selection can be optimised for the specific goal. A lifter in a fat loss phase struggling with hunger benefits from selecting protein sources at the lean end of the range (chicken breast, egg whites, low-fat yoghurt, cottage cheese) that deliver protein without meaningful fat or carbohydrate contribution, which creates macro budget for other foods elsewhere in the day. A lifter in a muscle gain phase struggling to hit calorie targets benefits from selecting protein sources at the mixed end of the range (whole eggs, salmon, ribeye, whole milk yoghurt) that deliver protein alongside meaningful fat, which reduces the total food volume needed to hit calorie targets.
A third consideration is dietary diversity. Building a broad library of sources within each macronutrient category, rather than relying on the same two or three foods, tends to support micronutrient intake, gut microbial diversity, and long-term adherence more effectively than a narrow rotation. The distribution charts help identify options within each category that fit specific contexts, which supports variety without compromising the macro plan.
For a more focused look at how food selection interacts with satiety through the protein and fibre density lens, our article on the most satiating foods covers the protein and fibre density map that complements this macro distribution reference.
How Do Protein Sources Actually Distribute Across the Macros?
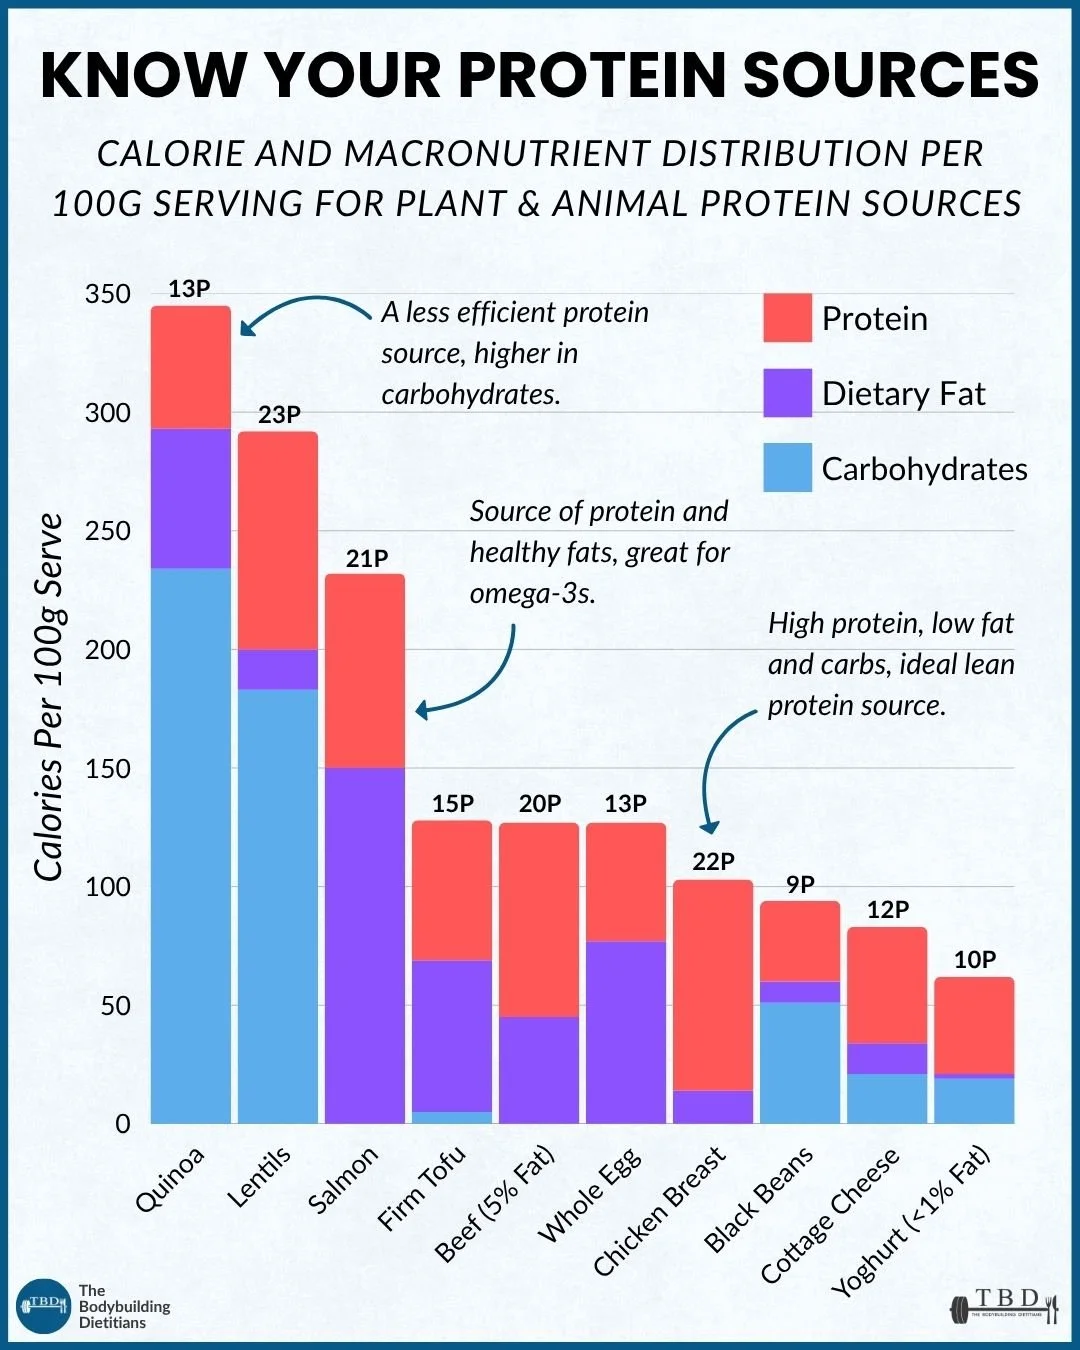
Protein sources vary substantially in the fat and carbohydrate they carry alongside their protein content. The chart shows ten common protein sources ordered from highest to lowest total calorie content per 100 grams, with each bar showing how the calories break down across protein, fat, and carbohydrate.
Four patterns are worth noting.
Lean animal proteins deliver protein with minimal other macros. Chicken breast provides approximately 22 grams of protein per 100 grams with less than 5 grams of fat and no meaningful carbohydrate, totalling around 100 calories. Low-fat yoghurt and cottage cheese sit in a similar profile with slightly lower protein content per 100 grams (10 to 12 grams) but similarly clean macro distribution. These are the foods that make the largest daily protein target hittable within tight calorie budgets, which is why they dominate the food rotations of lifters in cutting phases.
Higher-fat animal proteins carry substantial fat alongside their protein. Salmon delivers approximately 21 grams of protein per 100 grams alongside 12 to 15 grams of fat, totalling around 230 calories. Whole eggs provide approximately 13 grams of protein per 100 grams alongside 9 to 10 grams of fat, totalling around 125 calories per 100 grams (or about 75 calories per whole egg). Lean beef at 5 percent fat delivers 20 grams of protein per 100 grams alongside about 5 grams of fat. These foods are useful for their protein contribution but need to be counted for their fat contribution as well, particularly when total daily fat sits at the lower end of the target range.
Legume and grain-based plant proteins carry substantial carbohydrate alongside their protein. Lentils provide approximately 23 grams of protein per 100 grams (raw weight) alongside 60+ grams of carbohydrate, totalling nearly 300 calories per 100 grams. Quinoa provides approximately 13 grams of protein per 100 grams alongside high carbohydrate content, which is why it functions more as a mixed protein and carbohydrate source than a pure protein. Black beans sit at the lower end of the calorie range at 92 calories per 100 grams (cooked) with 9 grams of protein alongside meaningful carbohydrate.
Firm tofu sits in a mixed profile with moderate protein, moderate fat, and low carbohydrate. At approximately 15 grams of protein and moderate fat per 100 grams, tofu delivers a balanced macro profile that fits well into meals where protein is a priority but calorie budget allows for some fat contribution alongside.
The practical implication of these patterns is that "protein source" selection should be goal-specific. Lean options (chicken breast, egg whites, low-fat yoghurt, cottage cheese) work best for fat loss and tight calorie phases. Mixed options (whole eggs, salmon, moderate-fat beef, firm tofu) work well when calorie targets allow for the additional fat contribution. Legume-based options (lentils, black beans) work particularly well when meal planning is set up to count them as both a protein and a meaningful carbohydrate contribution rather than as a pure protein source.
For a more detailed look at how these protein sources compare on cost per gram of protein, our protein sources ranked by calories and cost article covers the economic side of protein selection.
How Do Carbohydrate Sources Actually Distribute Across the Macros?
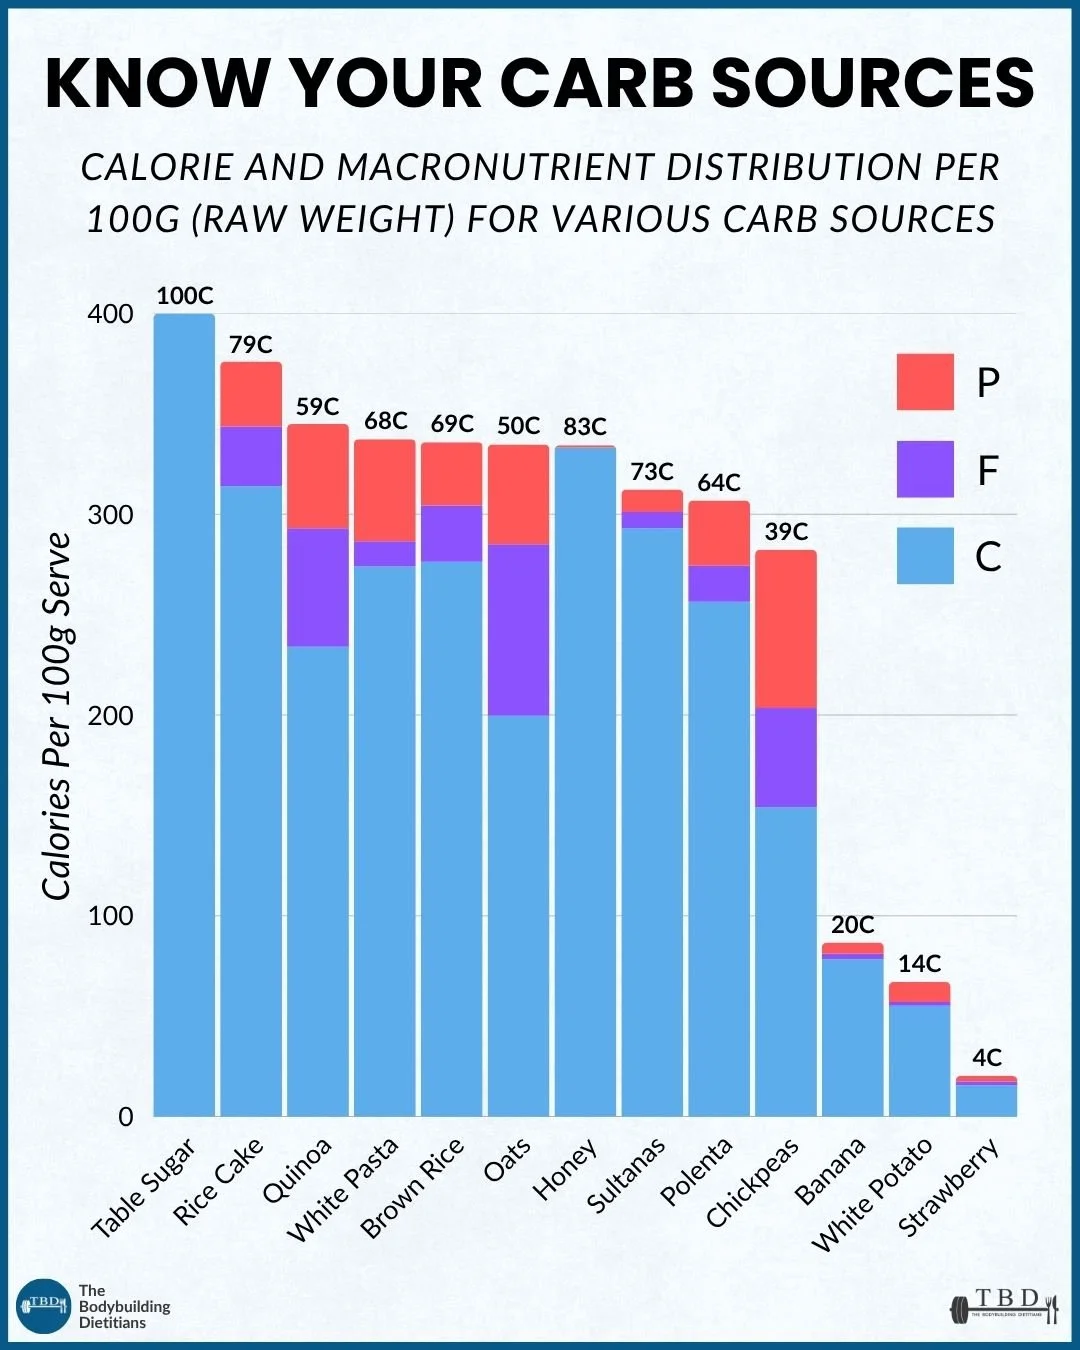
Carbohydrate sources vary from nearly pure carbohydrate through to mixed macronutrient profiles that deliver meaningful protein and fat alongside the carbohydrate content. The chart shows thirteen common carbohydrate sources ordered from highest to lowest total calorie content per 100 grams (raw weight).
Three patterns emerge from the chart.
Refined sugars and starches approach pure carbohydrate. Table sugar delivers 100 grams of carbohydrate per 100 grams with no protein or fat, totalling 400 calories. Honey delivers approximately 83 grams of carbohydrate per 100 grams with minimal other macros. Rice cakes sit at approximately 79 grams of carbohydrate per 100 grams with small amounts of protein and negligible fat. These foods contribute energy almost exclusively through carbohydrate and are the cleanest carbohydrate sources when macro counting requires precision.
Whole grains and starches deliver carbohydrate alongside meaningful protein. Brown rice, white pasta, polenta, and sultanas all deliver 60 to 75 grams of carbohydrate per 100 grams alongside 5 to 12 grams of protein. These foods function as primary carbohydrate sources in most meals but contribute meaningfully to daily protein totals when consumed in typical serving sizes. Oats stand out as a whole grain that delivers approximately 50 grams of carbohydrate per 100 grams alongside 13 grams of protein and 7 to 8 grams of fat, which puts oats close to the boundary between a carbohydrate and a mixed macronutrient source. Quinoa sits in a similar profile at 59 grams of carbohydrate with substantial protein and some fat.
Legumes deliver carbohydrate alongside substantial protein and moderate fat. Chickpeas at 39 grams of carbohydrate per 100 grams (raw weight) alongside 19 grams of protein and 6 grams of fat function nearly as much as a protein source as a carbohydrate source. Combined with the lentil and black bean data from the protein chart, legumes function as mixed macronutrient contributors rather than as pure carbohydrate or pure protein sources.
Fruits and starchy vegetables sit at low calorie densities. Banana at 90 calories per 100 grams, white potato at 70 calories per 100 grams (raw weight), and strawberry at 25 calories per 100 grams all deliver primarily carbohydrate but at low enough energy density that they function as high-volume options within a calorie target. These are particularly useful during fat loss phases where the volume and satiety per calorie matters more than the density per gram.
The practical implication is that carbohydrate source selection should factor in both the primary carbohydrate contribution and the secondary protein and fat contributions. A meal built on brown rice or oats can be intentionally lower on the added protein and fat contributions from other sources because the carbohydrate source is already delivering meaningfully across all three macros. A meal built on white rice or table sugar (typical training-adjacent meals) will need the protein and fat contributions to come entirely from other components, which is often exactly what's wanted around training when digestion speed is a consideration.
For a comparison of these carbohydrate sources on cost per gram of fibre, our fibre sources ranked by calories and cost article covers the fibre-focused selection framework.
How Do Fat Sources Actually Distribute Across the Macros?
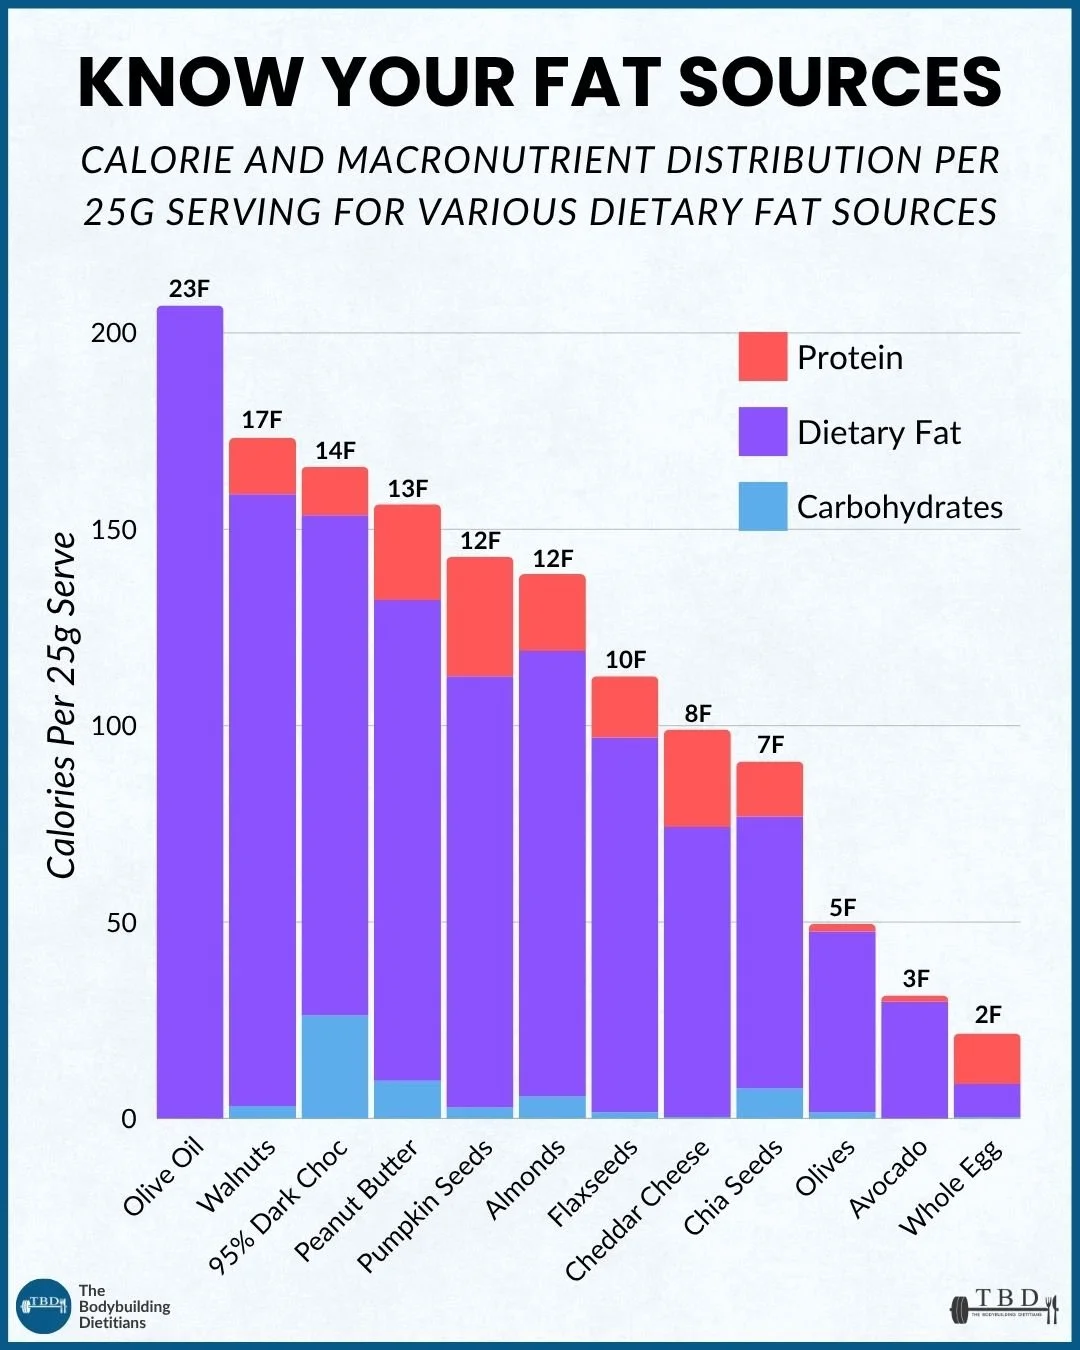
Fat sources vary substantially in their calorie density and in the protein and carbohydrate they carry alongside the fat content. The chart shows twelve common fat sources ordered from highest to lowest calorie content per 25 gram serving.
Three patterns emerge from the fat chart.
Pure oils are essentially pure fat with minimal other macros. Olive oil delivers 23 grams of fat per 25 grams alongside no meaningful protein or carbohydrate, totalling approximately 205 calories per 25 gram serving. This makes olive oil the most calorie-dense entry on the chart per gram of food and the cleanest fat source for macro counting purposes. Similar profiles apply to other pure oils (avocado oil, sesame oil, macadamia oil).
Nuts, seeds, and higher-fat plant foods deliver fat alongside meaningful protein. Walnuts, almonds, pumpkin seeds, peanut butter, flaxseeds, and chia seeds all deliver 7 to 17 grams of fat per 25 gram serving alongside meaningful protein contributions of 3 to 6 grams. These foods function as mixed macronutrient contributions rather than pure fat sources, and their protein contribution should be counted toward daily totals rather than dismissed. Pumpkin seeds in particular deliver substantial protein alongside their fat content, which is why they appear high on the protein and fibre density chart in the food selection cluster.
Dairy and animal-based fat sources deliver fat alongside substantial protein. Cheddar cheese delivers 8 grams of fat per 25 grams alongside meaningful protein contribution. Whole eggs (when counted as a fat source rather than a protein source) deliver 2 grams of fat per 25 gram portion alongside protein. These foods have flexibility in how they are categorised in a diet plan: they can function as protein sources with fat contribution, or as fat sources with protein contribution, depending on the framing.
Higher-carbohydrate fat sources include dark chocolate and some nut butters. 95 percent dark chocolate delivers 14 grams of fat per 25 grams alongside some carbohydrate. This is a small amount of carbohydrate relative to the fat, but it's worth registering, particularly for lifters at very low carbohydrate intakes or during specific pre-workout meals where carbohydrate is being minimised.
Low-calorie-density fat sources include olives, avocado, and whole egg. Olives at 50 calories per 25 grams, avocado at 30 calories per 25 grams, and whole egg at 25 calories per 25 gram portion deliver fat at much lower calorie densities than pure oils or nuts. These are useful for lifters wanting a fat source at meal volume without the high calorie contribution that pure oils or nuts bring.
The practical implication is that fat source selection should match the calorie target and the specific meal context. Pure oils and calorie-dense nuts work well when a small amount of fat needs to add substantial calories (typical during muscle gain phases where hitting calorie targets is a genuine challenge). Lower-density fat sources like olives, avocado, and whole eggs work well when the fat contribution should sit alongside meaningful food volume (typical during fat loss phases where satiety and meal size matter). Mixed sources like nuts and seeds work well when the protein contribution alongside the fat is genuinely useful.
Not Sure Which Sources to Prioritise for Your Own Goals?
Choosing food sources that match specific calorie and macro targets requires balancing several variables at once: the primary macronutrient contribution, the secondary macros the food carries, the calorie density relative to portion size, the satiety and volume characteristics, individual preferences, and cost. Our team works with clients to audit food rotations, identify the sources that fit their current goals, and build a broader library that supports both macro precision and dietary diversity over time.
How Do You Use These Charts to Build a Better Food Library?
The charts are most useful as a reference for building a broader library of foods within each macronutrient category, rather than as a prescription for which foods to choose.
Building a library rather than a rotation. Most lifters eat a rotation of 15 to 25 foods regularly. Using the charts to identify options across the lean-to-mixed spectrum within each category (rather than defaulting to the same two or three foods) supports both macro precision and dietary diversity. A lifter whose protein sources are chicken breast, tuna, and egg whites has excellent lean protein coverage but limited mixed protein options for meals where fat contribution is welcome. Adding salmon, whole eggs, or moderate-fat beef to the rotation covers a different macro profile and different micronutrient contributions.
Matching sources to phase and context. The specific source selection tends to shift across phases of training and dieting. Fat loss phases typically bias toward lean protein sources, higher-fibre carbohydrate sources, and lower-density fat sources for satiety per calorie. Muscle gain phases bias toward higher-density options across all three categories to make the calorie target hittable without excessive food volume. Maintenance phases sit somewhere between, with more flexibility to prioritise variety and preference over strict density optimisation.
Reading the whole meal rather than individual foods. A meal built from chicken breast, brown rice, and olive oil has one lean protein, one mixed carbohydrate, and one pure fat, which gives the meal precise macro control. A meal built from whole eggs, oats, and peanut butter has three mixed macronutrient contributors, which produces a more complex profile that's harder to count precisely but often more satisfying and more nutritionally diverse per meal. Neither is inherently better, and different situations call for different approaches.
Micronutrient diversity as a secondary goal. The charts show macronutrient distribution, but food selection also shapes micronutrient intake. Building variety across the sources within each macronutrient category tends to broaden the micronutrient profile of the overall diet. A lifter whose fat sources include olive oil, nuts, seeds, dairy fat, and oily fish covers a much broader micronutrient and fatty acid profile than a lifter whose only fat source is olive oil.
For a more detailed look at how to translate these food selection principles into meal-level structure, our five-part meal framework article covers the structural template we use with coaching clients.
Practical Takeaways
Almost every whole food delivers meaningful amounts of at least two macronutrients, and often all three. Single-category thinking about food is useful shorthand but can lead to underestimating calorie contributions from unaccounted macros and missing opportunities to use the actual distribution as a food selection tool.
Protein sources vary from lean options (chicken breast, egg whites, low-fat yoghurt, cottage cheese) that deliver protein with minimal fat or carbohydrate to mixed options (whole eggs, salmon, moderate-fat beef, firm tofu) that carry substantial fat, to legume-based options (lentils, black beans, quinoa) that carry substantial carbohydrate alongside the protein.
Carbohydrate sources vary from near-pure carbohydrate (table sugar, honey, rice cakes) to mixed macronutrient sources (oats, quinoa, chickpeas) that deliver meaningful protein and fat alongside the carbohydrate. Legumes function as both a protein and a carbohydrate contribution rather than as pure sources of either.
Fat sources vary from pure oils (olive oil at 205 calories per 25 grams with no other macros) to mixed sources (nuts, seeds, dairy, dark chocolate) that carry meaningful protein and some carbohydrate. Calorie density varies widely (olive oil at 205 calories per 25 grams versus avocado at 30 calories per 25 grams).
Source selection should match phase and context. Fat loss phases typically bias toward lean sources across all three categories for satiety per calorie. Muscle gain phases bias toward higher-density options to make calorie targets hittable. Building a broad library across the spectrum within each category supports both macro precision and dietary diversity.
Micronutrient diversity is a secondary goal supported by food variety within each macronutrient category. A rotation that includes lean and mixed options across all three macros tends to deliver a broader micronutrient profile than a narrow rotation.
Frequently Asked Questions
Do all foods contain all three macronutrients?
Almost all whole foods deliver at least two macronutrients, and most deliver meaningful amounts of all three. Pure refined sources are the main exceptions: table sugar and honey are essentially pure carbohydrate, olive oil and other pure oils are essentially pure fat, and pure protein isolates (whey isolate, casein isolate) are essentially pure protein. Whole foods (chicken breast, oats, salmon, eggs, avocado) deliver meaningful amounts of at least two macros and often all three, even when the food is filed into a single category for meal-planning shorthand.
Which protein sources are best for fat loss?
Lean protein sources that deliver protein with minimal fat or carbohydrate contribution work best for fat loss phases. Chicken breast, egg whites, low-fat Greek yoghurt, cottage cheese, tuna, and white fish all deliver 20 to 25 grams of protein per 100 grams with minimal other macros, which creates macro budget for other foods elsewhere in the day. Higher-fat protein sources (whole eggs, salmon, ribeye) work well during fat loss too but need to be counted for both their protein and fat contributions.
Which fat sources are the most calorie-dense?
Pure oils are the most calorie-dense fat sources, with olive oil delivering approximately 205 calories per 25 grams (over 800 calories per 100 grams). Nuts and seeds sit next at 140 to 175 calories per 25 grams. Dairy fats and higher-cocoa chocolates sit at 100 to 165 calories per 25 grams. Olives, avocado, and whole eggs are the least calorie-dense fat sources on the chart at 25 to 50 calories per 25 gram portion, which makes them useful for lifters wanting fat volume without the high calorie contribution.
Do oats count as a carbohydrate or a protein source?
Oats function primarily as a carbohydrate source but deliver enough protein and fat to be considered a mixed macronutrient contribution. A 100 gram (raw weight) serving of oats delivers approximately 50 grams of carbohydrate, 13 grams of protein, and 7 grams of fat, totalling around 380 calories. In meal planning terms, oats are usually counted as a carbohydrate source but the protein contribution is worth registering, particularly at larger serving sizes where the protein contribution can be substantial.
Should I only eat lean protein sources?
No. Lean protein sources are useful during fat loss and tight calorie phases because they deliver protein without additional fat or carbohydrate. Mixed protein sources (whole eggs, salmon, moderate-fat beef, tofu) deliver protein alongside meaningful fat, which is genuinely useful during muscle gain phases and often preferred for taste, satiety, and nutritional variety. Building a rotation that includes both lean and mixed options supports both macro precision and dietary diversity.
How do these charts help with meal planning?
The charts help by showing which foods deliver a single macro cleanly (useful for precise macro control) and which foods deliver mixed profiles (useful when the additional macros are wanted, or need to be counted when they aren't). Using this information, meals can be constructed to match specific targets: a lean chicken breast plus rice plus olive oil meal has three clean single-macro contributors and precise control, while a whole eggs plus oats plus peanut butter meal has three mixed contributors that are harder to count precisely but often more nutritionally diverse and satiating per meal.
If you want help auditing your current food rotation, identifying the specific sources that fit your calorie and macro goals, and building a broader library that supports both macro precision and long-term dietary diversity, our team can build a plan matched to your training, budget, and lifestyle. You can enquire about coaching or book a consultation with our team.