The calorie total and the sum of the macros in a tracking app rarely add up to the same number, and it doesn't mean anything has gone wrong on your end. This guide walks through the five reasons behind the discrepancy and when the difference actually matters for training and body composition outcomes.
The calorie total displayed in a tracking app rarely equals the sum of the macros multiplied by their standard energy values (4 for protein, 4 for carbohydrate, 9 for fat) for five main reasons: user-generated database entries with inaccurate calorie or macro values, rounding of every macro entry to the nearest whole number that compounds across 30 or more foods per day, the fact that Atwater factors are simplified averages and actual metabolisable energy varies by food source, the use of calories rather than kilojoules as the tracking unit which introduces additional rounding, and hidden energy contributors like sugar alcohols, alcohol, and dietary fibre that either don't appear in the macronutrient breakdown or vary between Australian and US labelling conventions. None of these mean anything has gone wrong on the tracker's end. A tracked calorie is not a precise readout of intake; it is an approximation useful for identifying trends over time rather than making a mathematical claim about a specific day. Tracking accuracy matters more during plateaus, late-stage cuts, and contest prep than during maintenance or muscle gain phases.
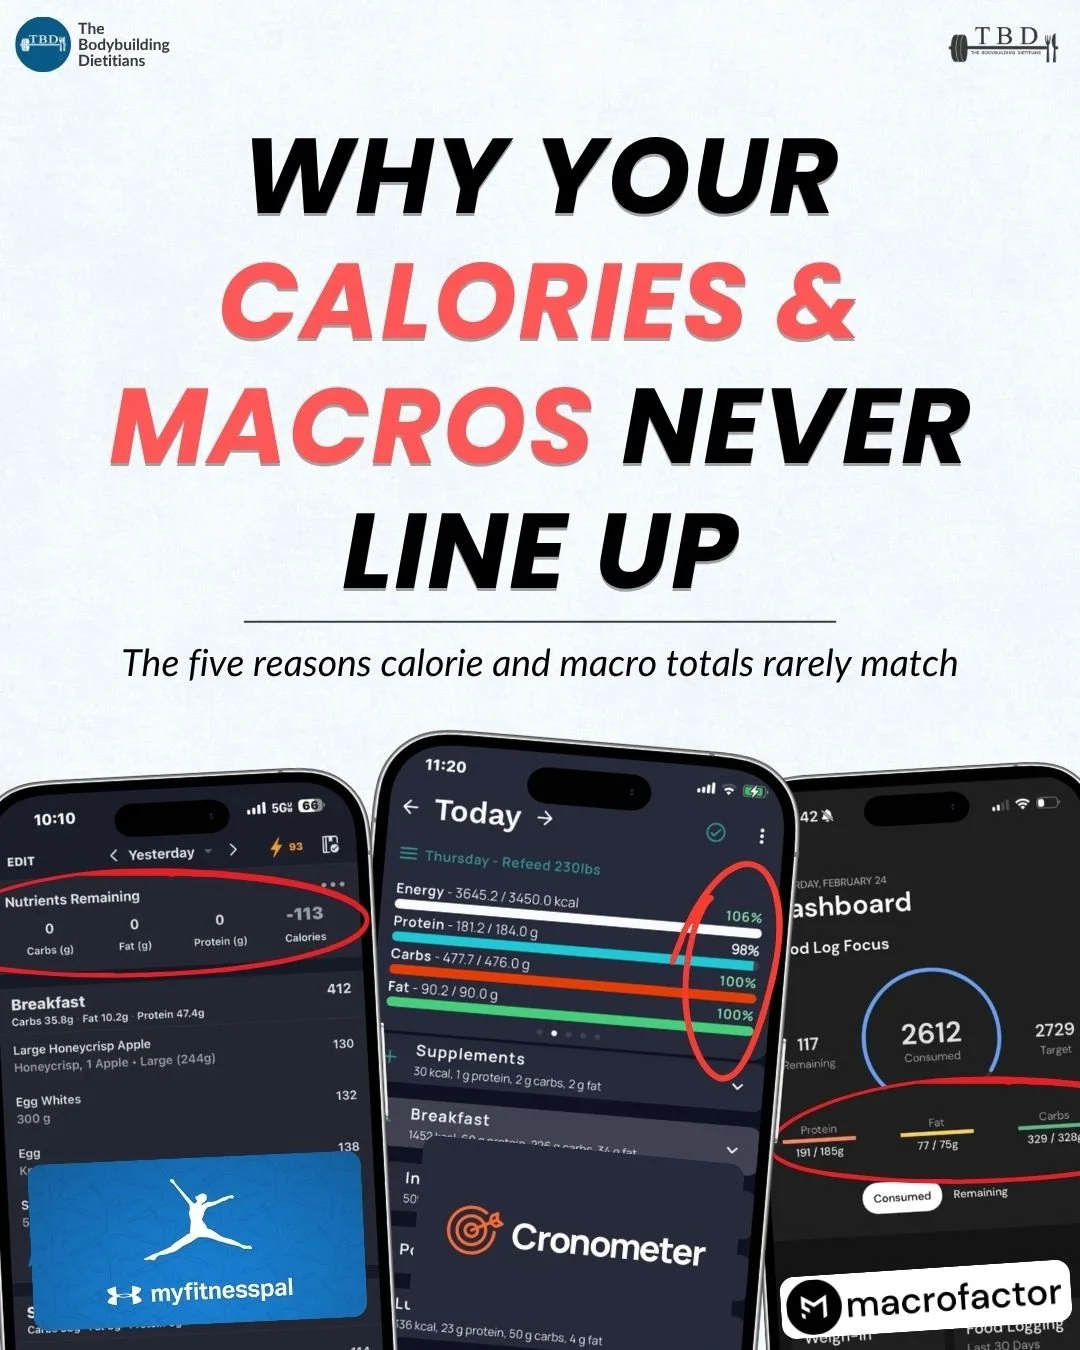
Anyone who has tracked calories and macros for more than a few weeks has noticed the same thing: the calorie total displayed in the app almost never matches what the individual macronutrient entries would produce if multiplied by their standard energy values. A day totalling 190 grams of protein, 250 grams of carbohydrate, and 70 grams of fat would work out to 2,390 calories using the standard 4-4-9 values, but the app might display 2,455 or 2,315 for the same day. The gap is real, it shows up across every major tracking platform, and it produces recurring confusion for anyone trying to make sense of their intake.
The discrepancy is not a bug in the app, an error on the tracker's part, or a sign that the calorie total is wrong. It is an inherent feature of how food composition data is collected, how tracking apps handle rounding, and how energy content is actually calculated in food science. Understanding the five main sources of the gap helps clarify what a tracked calorie actually represents (an approximation useful for identifying trends over time, rather than a mathematically precise readout) and when the discrepancy is worth acting on.
Why Do Calorie and Macro Totals Not Line Up?
Tracking apps are designed to make calorie and macronutrient tracking accessible and quick, which requires simplifying several layers of underlying food composition data that would otherwise be too complex to work with in practice. The simplification introduces small imprecisions at each stage, and those imprecisions compound across the 30 or more food entries in a typical day of tracking.
The result is that the calorie total displayed by the app and the sum of the macros multiplied by their standard energy values are almost never identical. Five specific sources of discrepancy account for most of the observed gap, and each one is baked into how tracking apps work rather than being something the individual tracker has done wrong.
The practical framing is that a tracked calorie is best understood as an approximation useful for identifying trends over time rather than a mathematical claim about a specific day. The information is genuinely useful for calibrating intake and identifying patterns in what actually gets eaten, but it should not be treated as though it produces a precise energy readout to the calorie.
For a detailed look at the user-input errors that sit alongside these app-side discrepancies (weighing methods, database selection, generic entries, high-density foods), our article on the six most common macro tracking errors covers the input side of the accuracy question.
Where Does Human Error in Database Entries Come From?
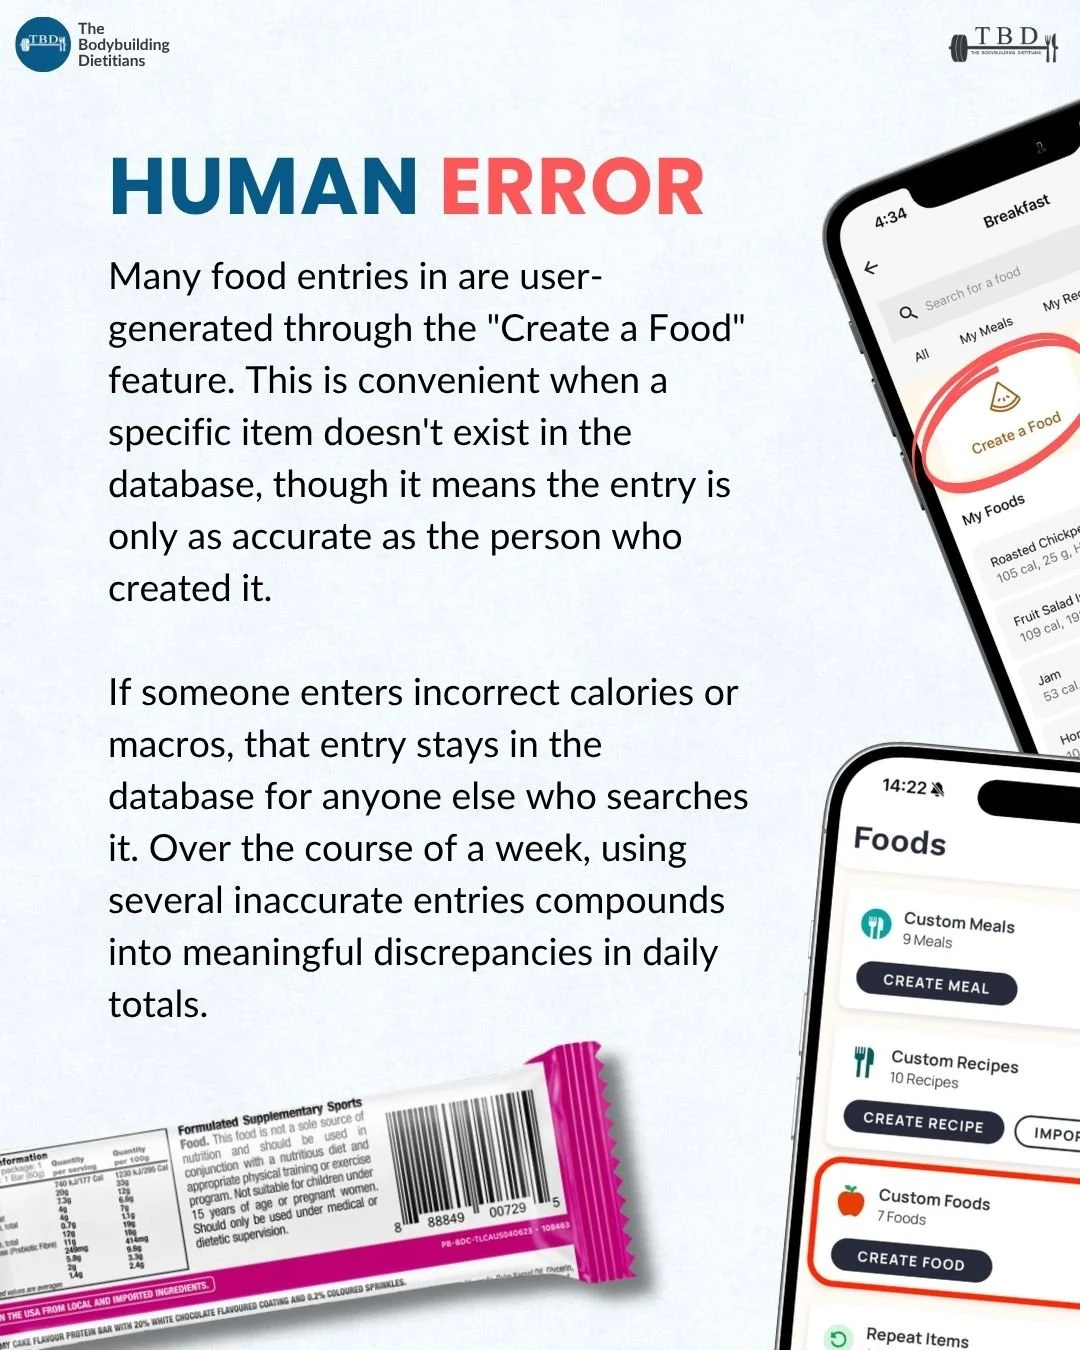
Many of the food entries in tracking apps are user-generated through a "Create a Food" feature that lets any user add a new entry to the database. This is convenient when a specific product doesn't already exist in the app's core database (a new supplement, a small local product, a homemade recipe), but it means the entry is only as accurate as the person who created it.
If someone enters incorrect calorie or macro values when creating a food (whether by mistyping, misreading the nutrition panel, or entering per-serving values when the app expects per-100g), that inaccurate entry stays in the database for anyone else who searches for the same product. Over the course of a week of tracking, using several such user-generated entries can compound into meaningful discrepancies in daily totals.
This is one of the reasons different tracking apps produce different results for what appears to be the same food. MyFitnessPal, for example, has a very large user-generated food database, which gives it broad coverage but variable accuracy across individual entries. Cronometer and Macrofactor rely more heavily on curated databases and verified entries, which produces more consistent accuracy but sometimes less coverage of obscure or region-specific products.
The practical adjustment is to prefer verified entries (those sourced from established food composition databases like NUTTAB in Australia or USDA in the US, or from manufacturer barcode scans) over user-generated ones. This does not eliminate the calorie-macro discrepancy entirely (the other four sources still apply), but it removes one of the largest and most avoidable inputs to the gap.
How Do Rounding Errors Compound Across the Day?
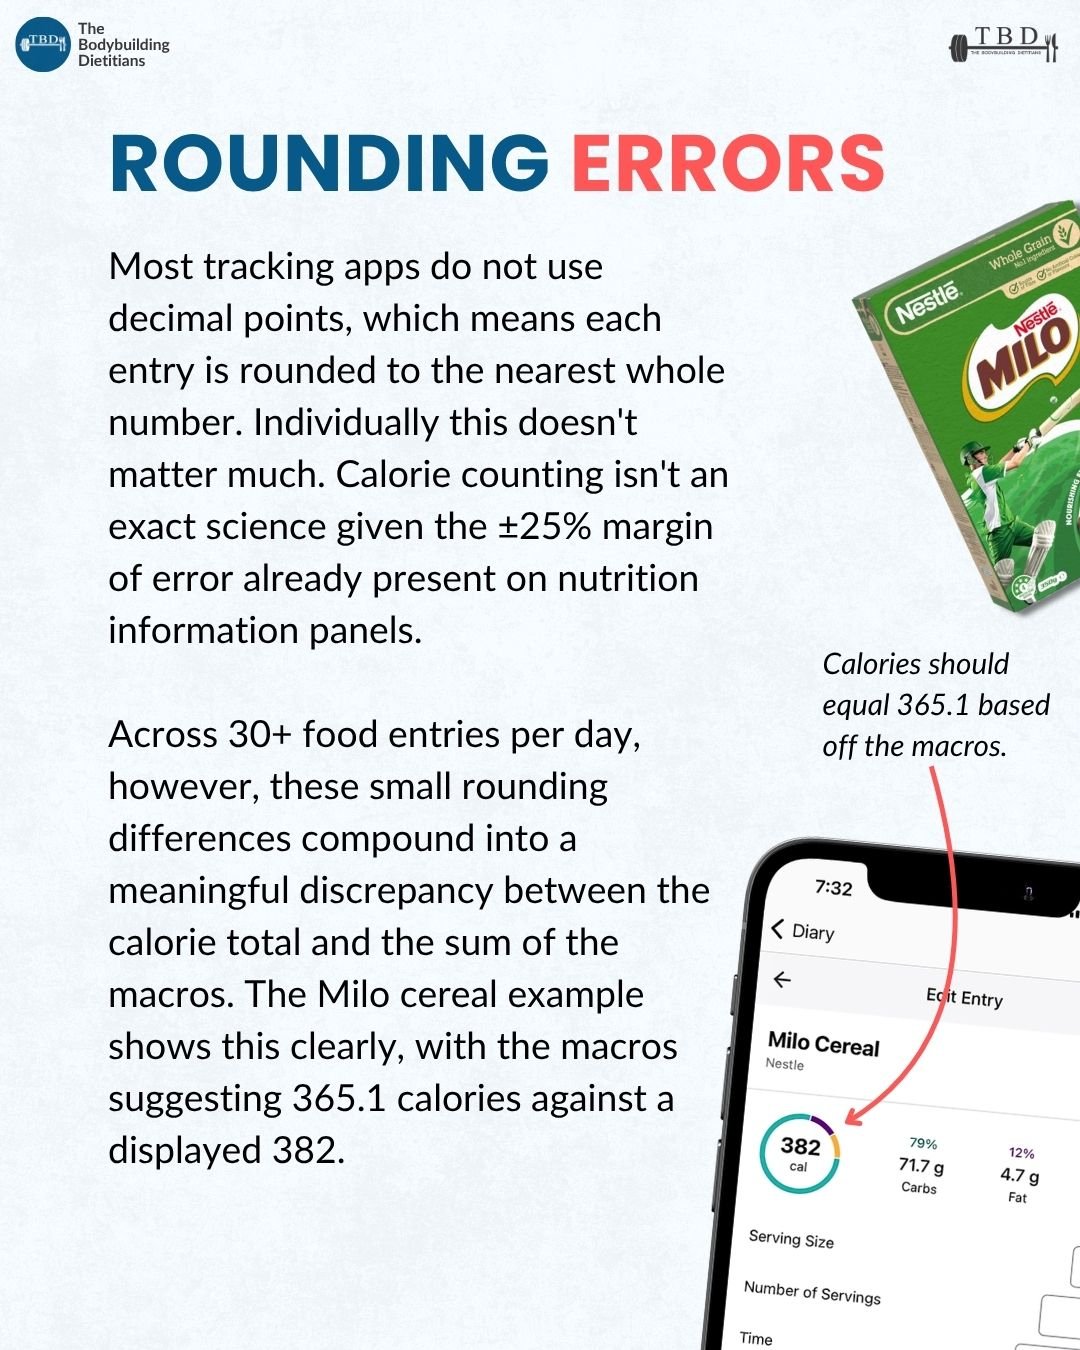
Most tracking apps do not display individual food entries to decimal places. A meal that actually contains 47.3 grams of protein, 61.8 grams of carbohydrate, and 14.6 grams of fat gets displayed as 47, 62, and 15, with each macronutrient rounded to the nearest whole number. This rounding happens at the individual food level rather than at the daily total level, which means the compounding effect is larger than it might initially appear.
The discrepancy from any single food entry is small (typically a fraction of a calorie), but the effect scales linearly with the number of foods logged. Across 30 or more food entries per day, small rounding differences compound into a meaningful discrepancy between the sum of the macros and the calorie total the app displays. A daily total of 100 to 200 calories in gap is common on high-frequency tracking days, and this gap is entirely a product of the rounding rather than any tracker error.
The example in the carousel makes this concrete. A serving of Milo cereal displayed as 382 calories with a macro breakdown of 71.7 grams of carbohydrate, 4.7 grams of fat, and a small protein contribution would work out to approximately 365 calories using the standard 4-4-9 energy values. The 17 calorie gap on a single food entry is small, but the same pattern across 30 foods per day produces a substantially larger daily gap.
The nutrition information panels on food packaging also carry their own inherent variability. In Australia, there is no formal tolerance limit established in food legislation, and academic research on the accuracy of Australian nutrition information panels has found that actual analysed values can vary by 13 percent below to over 60 percent above the labelled values for individual nutritional components. This variability is baked into the values that tracking apps use as their starting point, and it is unavoidable regardless of how carefully the tracker weighs and logs.
Why Are Atwater Factors Not as Exact as 4-4-9?
The standard energy values used to convert grams of macronutrients into calories (4 kcal per gram for protein, 4 kcal per gram for carbohydrate, 9 kcal per gram for fat, and 7 kcal per gram for alcohol) are known as the Atwater general factors. They are simplifications of the underlying food composition science, and while they are close enough for most practical purposes, they are not exact.
The Atwater specific factor system, developed by Merrill and Watt in the 1950s, recognises that different food sources of the same macronutrient can have meaningfully different metabolisable energy values. Protein from eggs, for example, has a specific Atwater factor of approximately 4.36 kcal per gram, while protein from some vegetable sources has a specific factor as low as 2.44 kcal per gram due to lower digestibility. Similar variation exists for carbohydrate and (to a smaller extent) fat.
The FAO summary of the Atwater specific factor system gives the following ranges across common foods:
Protein: 2.44 to 4.36 kcal per gram Carbohydrate: 2.70 to 4.16 kcal per gram Fat: 8.37 to 9.02 kcal per gram Dietary fibre: approximately 1.5 to 2.0 kcal per gram (from bacterial fermentation to short-chain fatty acids) Alcohol: 6.9 kcal per gram
The variability in protein is the largest, reflecting genuine differences in the digestibility and metabolisable energy across animal and plant protein sources. The variability in fat is small enough that the 9 kcal per gram approximation holds up well across most foods. The dietary fibre value is not zero (as it is often assumed to be in casual macronutrient counting) but sits at approximately 1.5 to 2.0 kcal per gram based on partial fermentation in the colon.
Tracking apps that use the standard 4-4-9 values are working with simplified averages rather than food-specific values, and this contributes to a portion of the observed gap between calorie totals and macro sums. The alternative (calculating specific factors for every food entry) would produce more precise results but would require substantially more complex food composition data and would offer marginal practical benefit for most trackers.
How Does Kilojoules vs Calories Affect Tracking Precision?
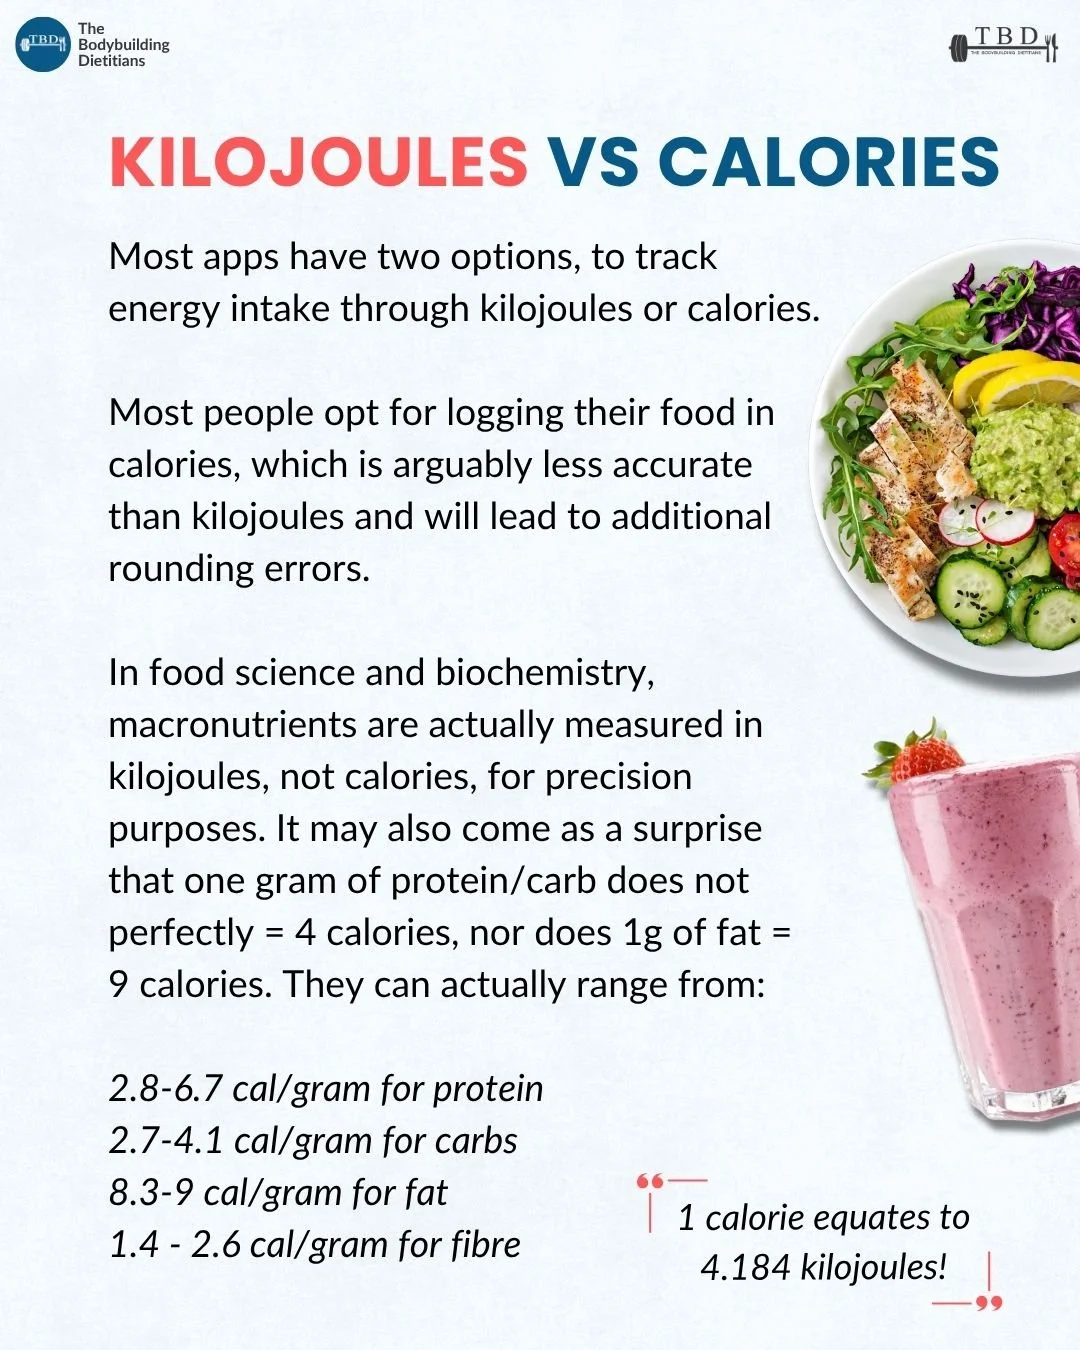
Most tracking apps offer the option of logging energy intake in either kilojoules or calories. Most people opt for calories, which is the more familiar unit in colloquial nutrition discussion, but this is arguably less precise than kilojoules and introduces additional rounding errors.
In food science and biochemistry, macronutrients are actually measured in kilojoules rather than calories, because the smaller numerical values in the kilojoule unit produce less rounding loss when displayed to whole numbers. Converting from kilojoules to calories (dividing by 4.184) reintroduces the fractional values, which then get rounded again when displayed as calories.
The Australian nutrition information panel convention is to display energy in kilojoules as the primary unit, with kilocalories often shown as a secondary value. Australian food composition data is also natively measured and stored in kilojoules. Tracking in kilojoules can produce slightly more precise readings for lifters based in Australia or working with Australian-sourced food data, at the cost of using a numerically unfamiliar unit.
The practical impact of this on daily totals is small, typically in the range of a few tens of calories across a typical tracking day. It is one of the smaller contributors to the overall calorie-macro gap, but it is a real one, and it explains part of why the two figures don't match.
What Are the Hidden Calories That Don't Appear in the Macro Breakdown?
Some food components contribute calories to the total energy content of a food but do not appear cleanly in the standard protein-carbohydrate-fat breakdown displayed by tracking apps. This produces a visible discrepancy where the calorie total is higher than what the macronutrient sum would suggest.
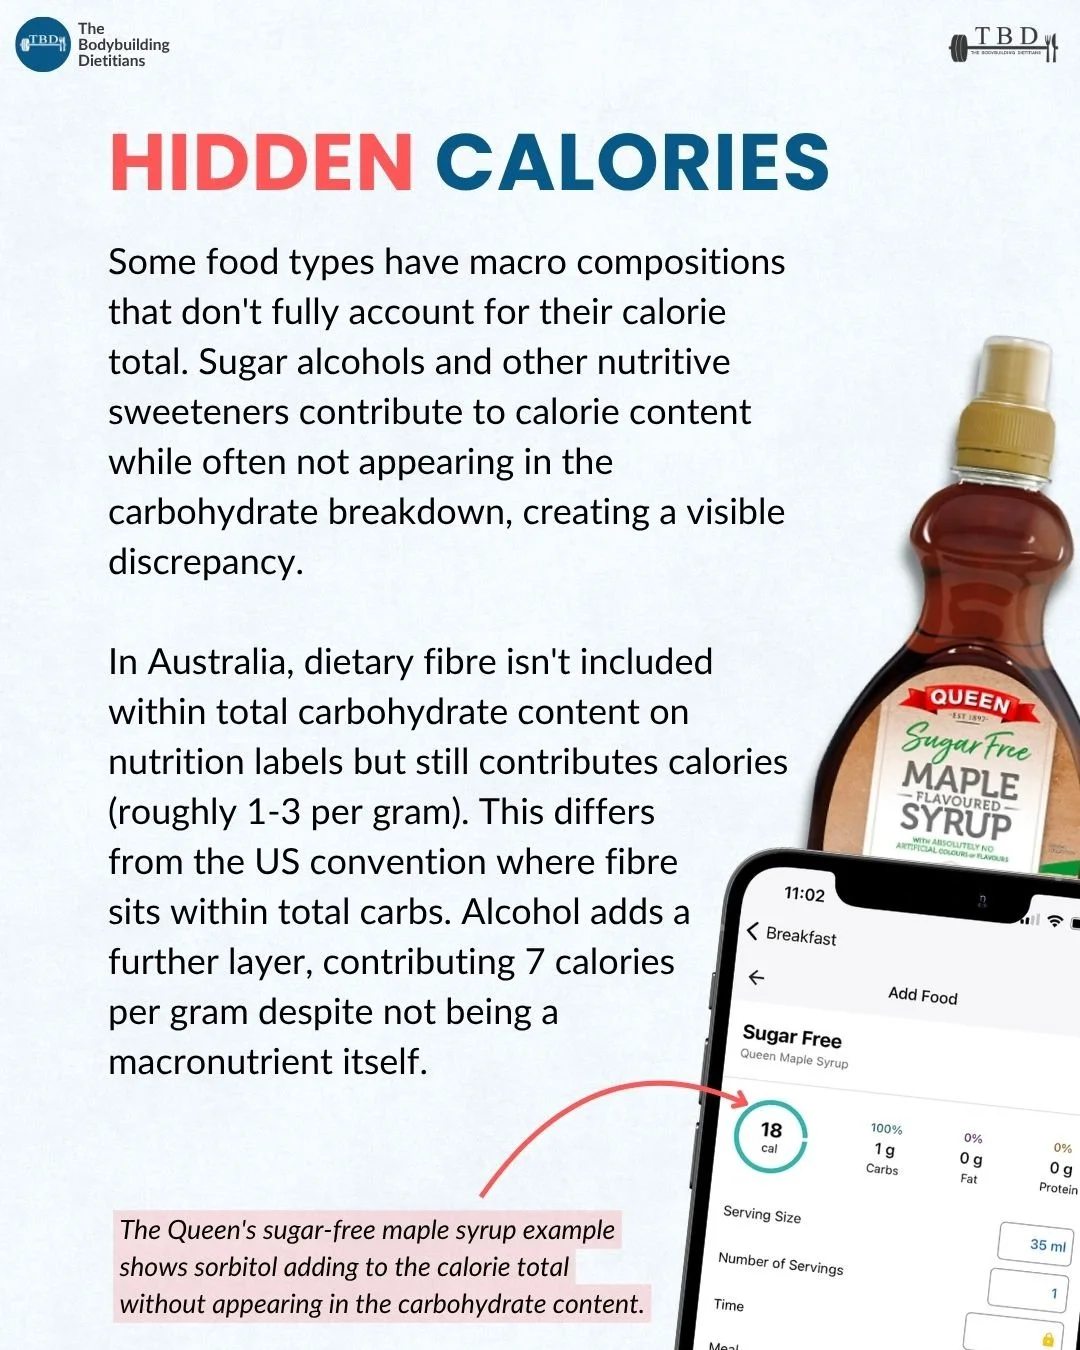
Sugar alcohols and other nutritive sweeteners are common in sugar-free products including chewing gum, low-sugar chocolates, protein bars, and diet drinks. Common examples include erythritol, xylitol, sorbitol, and maltitol. These contribute meaningful calories (approximately 0.2 to 3 kcal per gram depending on the specific sweetener) but often do not appear in the carbohydrate breakdown on the nutrition panel because they are not classified as sugars or standard carbohydrates. The Queen sugar-free maple syrup example in the carousel is a typical case: sorbitol contributes to the calorie total without appearing in the displayed carbohydrate content.
Dietary fibre contributes approximately 1.5 to 2 kcal per gram through bacterial fermentation to short-chain fatty acids in the colon, but the treatment of fibre in macronutrient breakdowns differs between countries. In Australia, dietary fibre is displayed separately from total carbohydrate on nutrition information panels, so the fibre calories don't appear within the carbohydrate figure that a tracking app might use. In the US convention, fibre is included within total carbohydrate on nutrition panels, which means the fibre calories are captured within the carbohydrate figure. This produces different apparent discrepancies depending on which regional convention the tracking database is using.
Alcohol contributes approximately 7 kcal per gram but is not classified as a macronutrient (protein, carbohydrate, or fat). Some tracking apps display alcohol as a separate field alongside the three macronutrients, while others fold the alcohol calories into the total without breaking them out. In both cases, the alcohol contribution to the calorie total sits outside the standard macronutrient breakdown, which produces a visible gap between the calorie total and the sum of protein-carbohydrate-fat multiplied by their standard energy values.
The combined effect of these hidden contributors depends on how much of them a particular tracking day contains. A day including several servings of sugar-free products, meaningful fibre intake, and a couple of alcoholic drinks can produce a calorie-macro gap of 100 to 200 calories from these sources alone, entirely separate from the rounding and Atwater factor sources of discrepancy.
When Does the Calorie-Macro Discrepancy Actually Matter?
The pattern that shows up most often in coaching is that tracking accuracy carries different weight depending on the phase of training and dieting. The calorie-macro discrepancy discussed above is a small enough source of noise that it rarely determines outcomes on its own, but the broader question of tracking accuracy has a phase-dependent answer.
During maintenance and muscle gain phases, the margin for error in tracking is wide. Small discrepancies between what the app displays and what the body is actually receiving are absorbed by the body's homeostatic adjustments and by the slightly relaxed accuracy requirements of these phases. A looser tracking approach where high-density foods are weighed and other items are estimated is generally fine, and the calorie-macro discrepancy is not worth troubleshooting.
During early-to-mid fat loss phases, tracking accuracy starts to matter more, but the calorie-macro discrepancy specifically is still not usually the limiting factor. The larger sources of error (user input errors, generic database entries, cooked versus raw weights, eyeballed high-density foods) tend to produce discrepancies substantially larger than the app-side sources discussed in this article. Addressing input accuracy usually produces bigger improvements than worrying about the calorie-macro gap.
During plateaus, late-stage fat loss, and contest prep, tracking accuracy becomes the variable that determines whether the next adjustment is actually needed. In these phases, the accumulated effect of all sources of tracking error (both user-input and app-side) is worth minimising, and the phase-specific consequences of misjudging intake are meaningful enough to justify tightening every input that can be tightened.
The most common pattern in coaching is a lifter reducing calories because the scale has not moved, when what actually happened is that the tracking gap widened due to a shift in food choices or a switch to less-verified database entries. Reducing calories before checking tracking accuracy is a predictable way to compound restriction unnecessarily.
Not Sure Whether to Tighten Your Own Tracking?
For lifters wondering whether tracking accuracy is actually the issue with a stalled phase, or whether the deficit itself needs adjusting, the answer depends on where the phase currently sits and what the trend data reflects. Our team helps clients read the outputs, tighten inputs where it matters, and adjust calorie and macro targets based on what the data actually shows rather than defaulting to further restriction.
How Do You Build Meaningful Accuracy Without Overengineering It?
The goal of tracking is calibration, not mathematical precision. The calorie and macro totals in tracking apps will never be perfect math, and applying a few practical adjustments improves accuracy meaningfully without turning tracking into a full-time preoccupation.
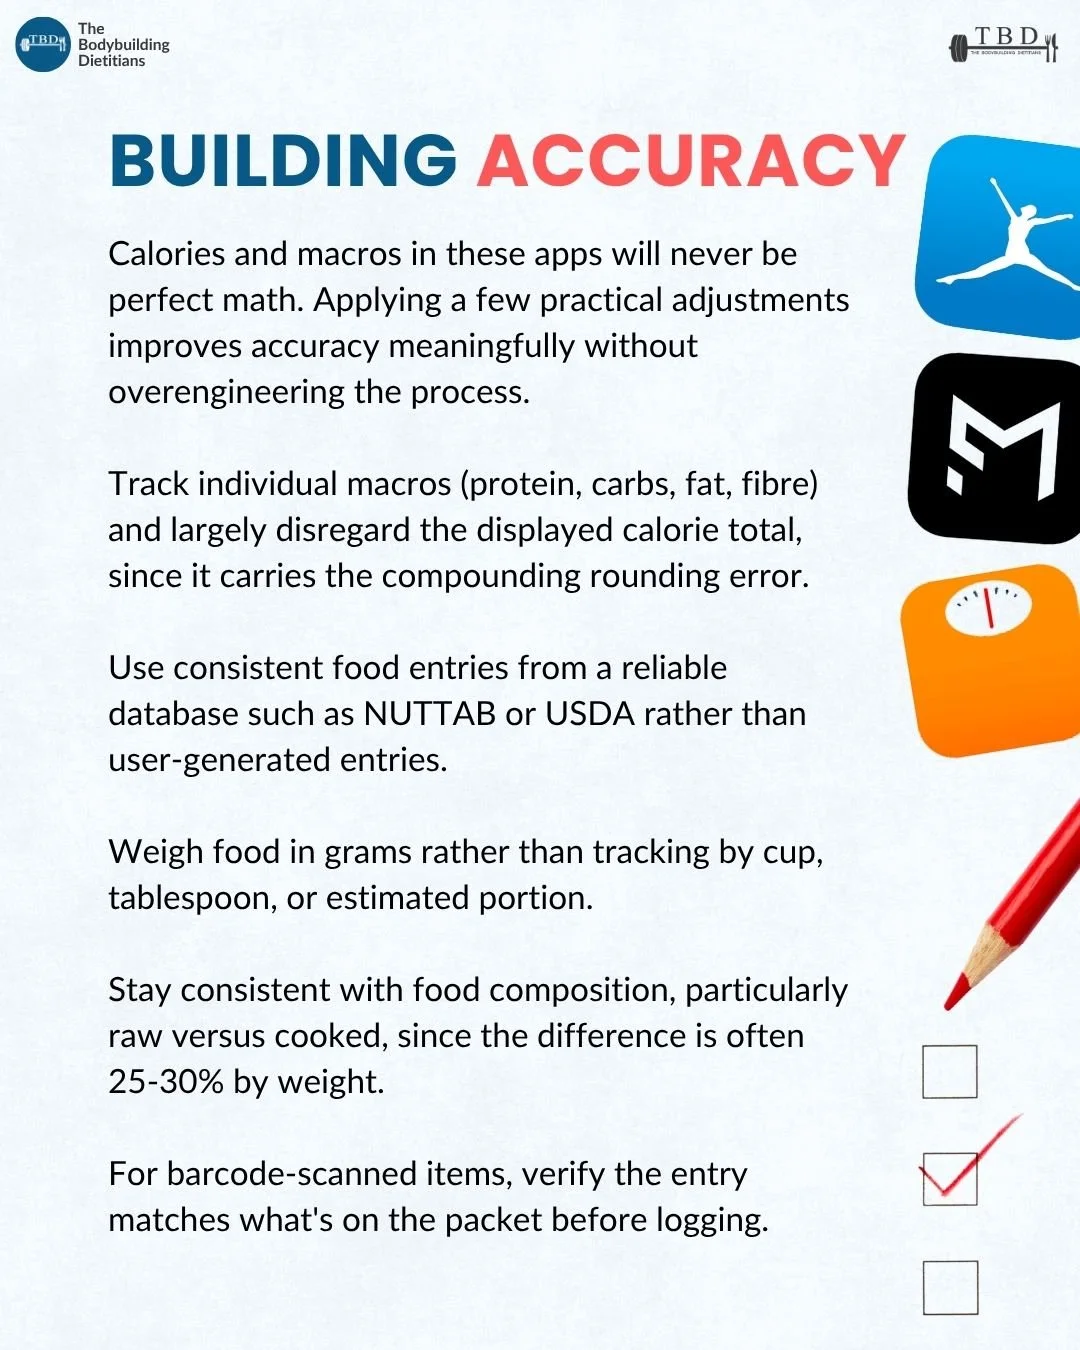
Track individual macros and largely disregard the displayed calorie total. The macronutrient entries carry less compounding rounding error than the calorie total, and the sum of the macros multiplied by 4-4-9 (or a slightly adjusted version accounting for fibre and alcohol) tends to be a more consistent readout than the displayed calorie figure itself.
Use consistent food entries from reliable databases. Verified entries from NUTTAB (Australia) or USDA (US), or from manufacturer barcode scans, produce more consistent tracking than user-generated entries. Selecting the same entry for a food across weeks of tracking also removes noise that comes from switching between differently sourced entries for the same food.
Weigh food in grams rather than tracking by cup, tablespoon, or estimated portion. Volume measurements introduce substantial variability that has nothing to do with the app-side discrepancies discussed in this article. Weighing removes one of the largest sources of tracking error entirely.
Stay consistent with raw versus cooked composition. Meat loses approximately 25 to 30 percent of its weight during cooking due to water loss. Weighing raw and tracking against a raw entry, or weighing cooked and tracking against a cooked entry, both work as long as the entry matches the weighing method. The common error of weighing cooked meat and tracking against a raw entry produces a substantial and one-directional underestimation of intake.
For barcode-scanned items, verify the entry matches what is on the packet. Barcode scans can pull outdated or region-mismatched entries, and a quick check that the displayed calorie and macro values match what is on the actual packet catches this before it becomes a compounding error over weeks of tracking.
Practical Takeaways
The calorie total displayed in a tracking app almost never equals the sum of the macros multiplied by 4-4-9, and this is a normal artefact of how tracking apps work rather than an error on the tracker's end.
Five sources of discrepancy account for most of the observed gap: user-generated database entries, rounding of individual food entries to whole numbers, the fact that Atwater factors are simplified averages, the use of calories rather than kilojoules as the tracking unit, and hidden energy contributors like sugar alcohols, alcohol, and (in Australia) dietary fibre that don't appear cleanly in the macronutrient breakdown.
Atwater specific factors vary meaningfully across foods: protein from 2.44 to 4.36 kcal/g, carbohydrate from 2.70 to 4.16 kcal/g, fat from 8.37 to 9.02 kcal/g, and dietary fibre from approximately 1.5 to 2.0 kcal/g. The standard 4-4-9 values are averages that mask this underlying variability.
A tracked calorie is best understood as an approximation useful for identifying trends over time rather than a mathematical claim about a specific day.
Tracking accuracy carries different weight depending on the phase. Plateaus, late-stage fat loss, and contest prep justify tightening every input that can be tightened. Maintenance and muscle gain phases generally do not.
Practical accuracy adjustments include tracking individual macros rather than relying on the calorie total, using verified database entries, weighing food in grams, staying consistent with raw versus cooked composition, and verifying barcode-scanned entries against the packet.
Frequently Asked Questions
Why don't my calorie and macro totals match in my tracking app?
The gap is a normal artefact of how tracking apps work rather than an error on your end. Five main sources contribute: user-generated database entries with inaccurate values, rounding of individual food entries to whole numbers, the fact that the standard 4-4-9 energy values are simplified averages rather than exact, additional rounding introduced by tracking in calories rather than kilojoules, and hidden energy contributors like sugar alcohols, alcohol, and dietary fibre that don't appear in the standard protein-carbohydrate-fat breakdown.
Are 4-4-9 calories per gram accurate for protein, carbs, and fat?
They are close approximations rather than exact values. FAO data shows Atwater specific factors ranging from 2.44 to 4.36 kcal per gram for protein (varying by food source), 2.70 to 4.16 kcal per gram for carbohydrate, and 8.37 to 9.02 kcal per gram for fat. The variability in protein is the largest, reflecting genuine differences in digestibility and metabolisable energy across animal and plant sources. The 4-4-9 values are simplified averages used because they are close enough for most practical purposes.
Does fibre have calories?
Yes, approximately 1.5 to 2 kcal per gram, from bacterial fermentation of the fibre to short-chain fatty acids in the colon. This is often assumed to be zero in casual macronutrient discussions, but it isn't. The treatment of fibre in nutrition labels differs by country: in Australia, dietary fibre is displayed separately from total carbohydrate on nutrition panels, while in the US convention fibre sits within total carbohydrate. This difference contributes to some of the observed gap between calorie totals and macro sums in tracking apps.
Which tracking app is most accurate?
Accuracy depends more on how the app is used than which app it is. Apps that rely on verified databases (like Cronometer and Macrofactor) tend to produce more consistent results out of the box than apps that rely heavily on user-generated entries (like MyFitnessPal), but the user's choice of specific entries within any app largely determines the accuracy. Using verified NUTTAB or USDA entries, weighing food in grams, and staying consistent with the same entries across weeks of tracking are more important than the specific app.
Should I track kilojoules or calories?
Kilojoules produce marginally more precise tracking because the smaller rounding steps in the conversion introduce less compounding error. In Australia, kilojoules are also the primary unit on nutrition information panels and in food composition data, which reduces conversion errors when tracking domestic products. Calories remain more familiar in colloquial nutrition discussion, and the practical difference between the two units is small enough that most trackers choose based on familiarity rather than precision.
How much should I actually worry about the calorie-macro discrepancy?
Not much for most phases. The discrepancy discussed in this article is a small enough source of tracking noise that it rarely determines outcomes on its own. During maintenance and muscle gain phases, the margin for error is wide enough that the gap doesn't warrant concern. During plateaus, late-stage fat loss, and contest prep, tracking accuracy in general becomes worth tightening, but the biggest gains come from addressing user-input errors (weighing methods, database selection, raw vs cooked) rather than from worrying about the app-side sources of discrepancy specifically.
If you want help interpreting your tracking data, tightening inputs where it matters, and adjusting your calorie and macro targets based on what the trend actually reflects, you can enquire about coaching or book a consultation with our team.